


PageOn.AI
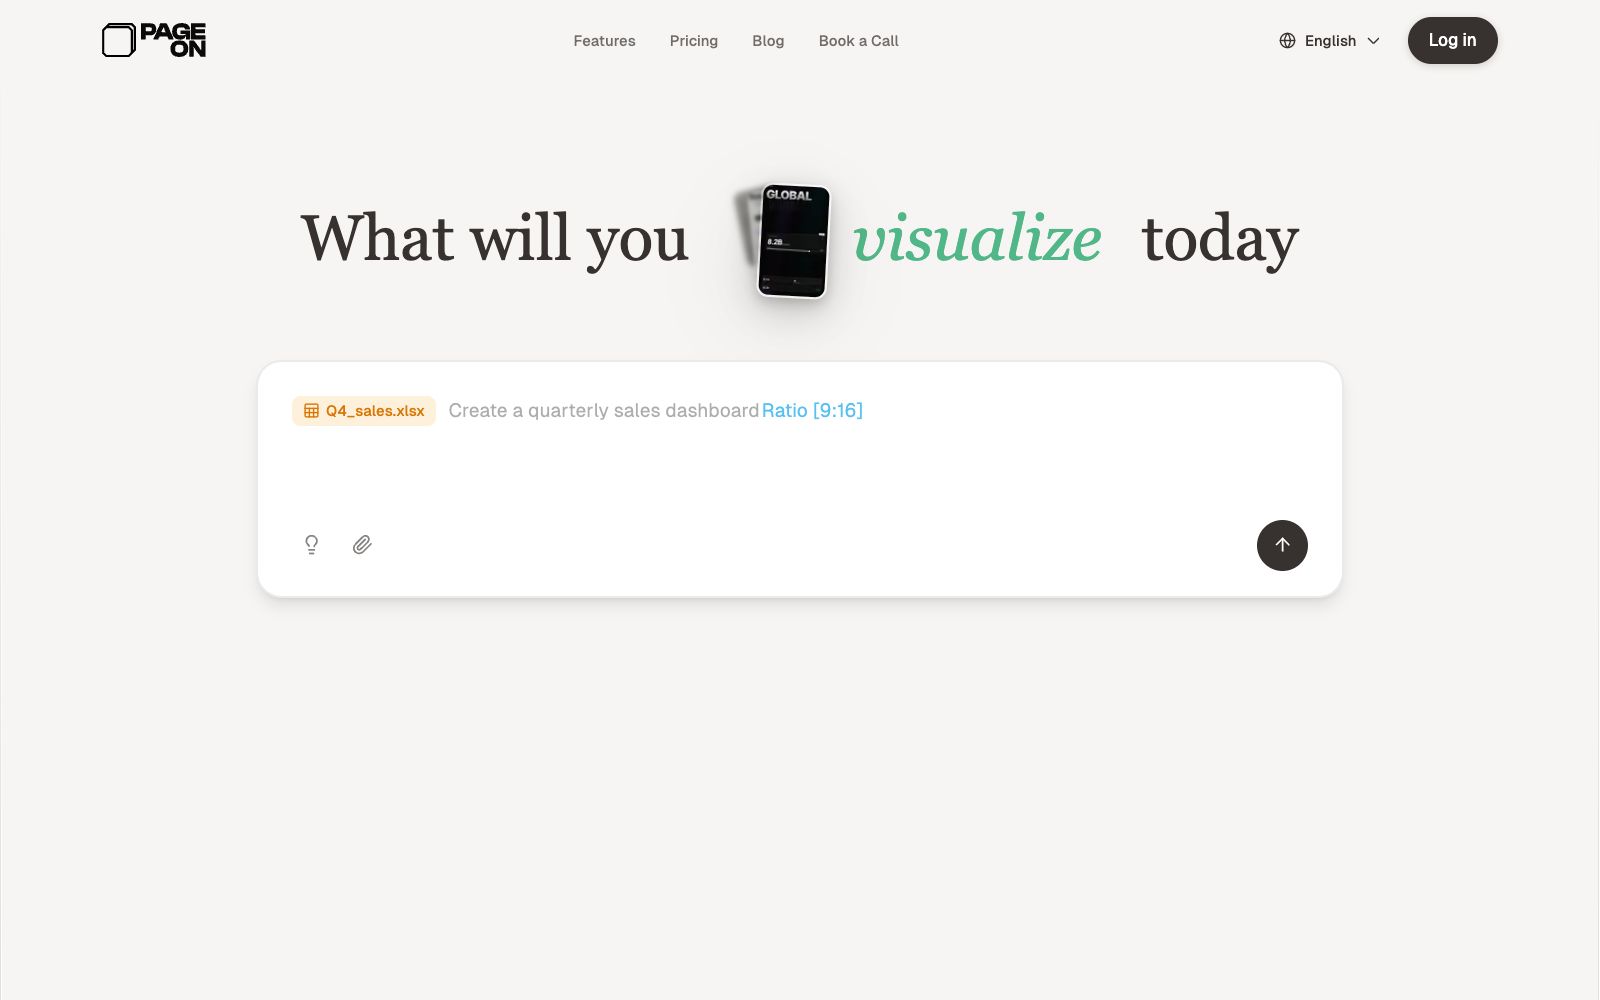
PageOn.AI is an AI presentation and infographic creation tool. It uses AI agents to help you research, plan and design your target into an interactive visual story. It supports real-time data visualization, geonarrative and vector animation, going beyond static slides.
Updated: 2026-10-26
What is PageOn.AI?
The official website of PageOn.AI describes itself as an "AI Presentation & Infographic Maker" and positions itself as a "visual version of Notion". It uses AI agents to understand your goals, automatically research topics, plan structures and turn ideas into dynamic, interactive pages—not just static slideshows.
Who is it for?
- Creators and bloggers: Convert TED Talks and articles into interactive presentations or social media infographics.
- Product and Marketing: Use real-time data and geographic storytelling to create more vivid proposals and client presentations.
- Consultants and researchers: Turn complex analyses into interactive visual stories for easy explanation and communication.
- Teams requiring brand consistency: Use brand settings to ensure a consistent style for external content.
Key features
8AI Agent
Tell it your goal, and the agent will research the topic, plan the structure, and design the final page.
Modular AI Blocks
Combine components such as charts, diagrams, 3D models, and media like building blocks.
Real-time Data Visualization
Integrate dynamic data into the page to display updated charts and key metrics.
Geographic Storytelling
Tell stories from a geographical dimension, combine locations with data for presentation, and enhance persuasiveness.
Vector Graphics and Animation
Generates vector graphics and animations, making the pages more expressive and textured.
Brand Consistency
After setting up your brand, the content and style will maintain a consistent tone in every generation.
Rich Media Integration
Embed rich media into pages to enhance storytelling and expressiveness.
Vibe Creation
Describe the style and feel in words, and let the AI agent plan and implement the expression.
How to use PageOn.AI
- Ensure the data sources are reliable and confirm the updates and authorization compliance before making the page public.
- Interactive pages may perform differently on mobile devices compared to desktop.
- Preview on multiple devices before official sharing.
- Start by generating a test with a clear goal (such as converting a video into a slide show) to familiarize yourself with the workflow of the AI agent.
- Interactive pages are suitable for online sharing.
- If you need to present them offline, confirm whether the export or publishing format is supported.
- Geographical storytelling and 3D models have requirements for materials.
- preparing clear source data makes it easier to achieve good results.
- Official templates and features (such as Product Hunt rankings) may be adjusted.
- double-check them before official use.
- When you start using it, it is recommended to first use the free quota to get the core workflow running smoothly, confirm that the output quality meets your expectations, and then evaluate whether it is worth upgrading to the paid plan.
Traffic & popularity
Data month Sep 2026
PageOn.AI receives about 189.3K visits per month and ranks #200,980 worldwide.
Monthly visits
12 monthsTraffic sources
- Search75.3%
- Direct14.4%
- Social3.6%
- Referrals3.0%
- AI assistants1.5%
- Other2.2%
Top countries
- United States15.4%
- Japan8.0%
- Ecuador6.6%
- Mexico4.8%
- Spain4.4%
Estimated from third-party traffic data.
Similar tools
 InfogramA data visualization tool under Prezi, it can create interactive charts, maps, infographics and reports, supports embedding and sharing, and its official website states that the entire process from charts to infographics can be assisted by AI.
 NarraLandNarraLand (Narrative Realm) is an AI visual creation platform. Officially, it claims that inputting ideas can automatically format them into graphic and text pages. It has built-in styles such as intelligent typesetting, one-click understanding with images, story cards, timelines and slides, covering self-media graphic and text content and business reports.
 GuidejarGuidejar automatically turns a single recorded workflow into step-by-step guides and interactive demos. It supports translation into more than 30 languages, branching paths, and MCP integration, with pricing starting at $19 per seat per month.
 PiktochartA veteran infographic and data visualization design platform, its official website states that it serves 34 million users. It offers Pikto AI Studio, which can quickly transform data into infographics, presentations, reports, e-books and videos without any design background.
 Chronicle AIChronicle AI is an AI presentation creation tool for professional teams. It can convert documents, notes and business data into editable, brand-compliant slides, and supports chart visualization, tool embedding, as well as export in multiple formats such as PPT and PDF.
 SciDraw AISciDraw AI is an AI scientific illustration and data visualization platform for researchers. Officially, it can generate paper-level illustrations from text or sketches, supports plotting with CSV data and editable export in SVG/PPTX formats, and is compatible with the submission specifications of mainstream journals.