


Aichart
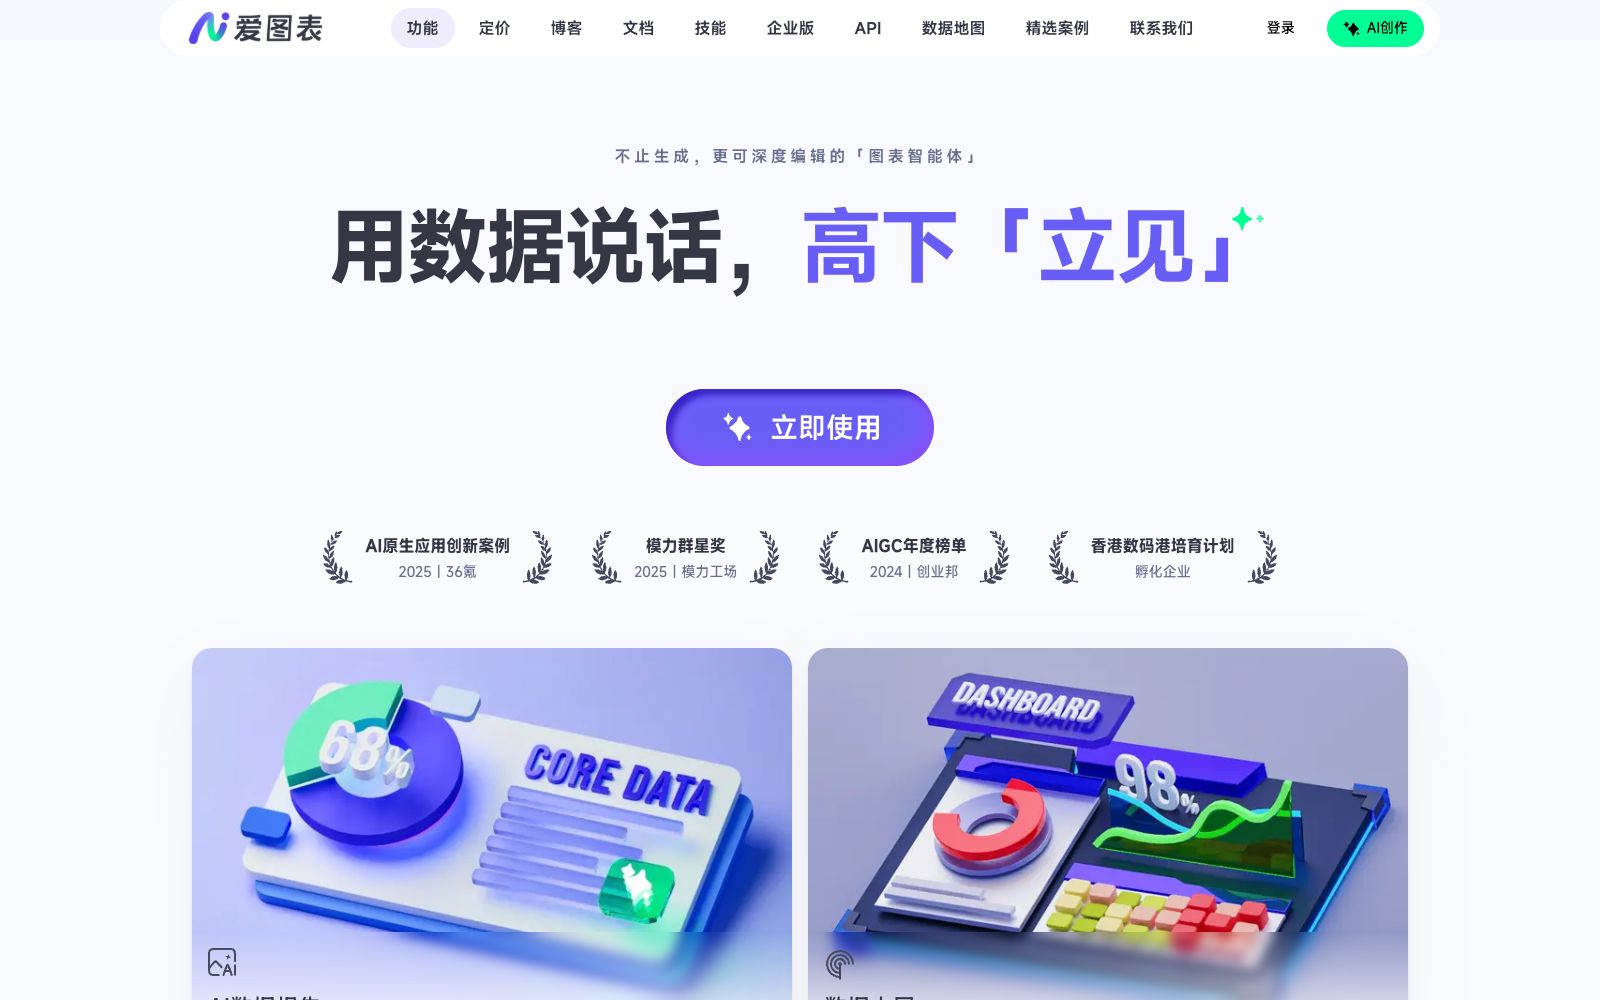
Aichart is an AI-driven visual content creation platform positioned as a "chart agent" with in-depth editing capabilities. It covers templates such as charts, PPTs, dashboards and long images, suitable for scenarios like reports, assignments and data dissemination.
Updated: 2026-10-26
What is Aichart?
The official website of Aitubiao positions itself as a "chart agent that not only generates charts but also enables in-depth editing" and describes its product as an "AI-driven visual content creation platform". Unlike tools that produce a single chart and then end, it focuses on continued editing after generation. The template center classifies content by forms such as charts, PPTs, dashboards, long web images, long mobile images, Xiaohongshu images, and data posters, covering common needs such as reporting, assignments, finance, and promotion.
Who is it for?
- Business teams that need to conduct regular operational and sales reviews: directly transform raw data tables into report pages with conclusions and actionable directions.
- Students working on course assignments and needing illustrations for their papers: They can complete data organization and chart creation in one go, reducing time spent on formatting.
- Finance, consulting and analysis roles: Need to quickly transform multi-dimensional data into trend charts and report structures for external delivery.
- New media and PR roles in content distribution: Convert complex data into shareable and easy-to-understand infographics and long images.
Key features
6Chart Generation and In-depth Editing
The official states that the generated results can be further edited in depth, rather than just exporting a finished chart; modifying data or structure does not require starting over from scratch.
Native PPT Export
The official version states that the AI will automatically extract core data conclusions, one-click match the brand's main colors of the enterprise, and support native PPT export for key meeting occasions.
Multi-form Templates
The template center offers various forms such as charts, PPTs, dashboards, long web images, long mobile images, Xiaohongshu images, and data posters, which can be selected according to scenarios.
Financial and Sales Analysis
Quickly generate multi-dimensional financial charts to clearly present data changes and key trends; it can also automatically summarize sales data, identify trend changes and critical issues, and support multi-round review and comparison.
Academic Research and Consulting Analysis
Suitable for academic research and consulting analysis, it automatically generates charts and report structures, helping to efficiently present complex research content and improve the quality of expression.
Homework and Report Expression
Automatically organizes data and content structures, generates clear charts and homework presentations, completes the process from materials to conclusions with one click, and supports multi-round revision and optimization.
How to use Aichart
- First, go to the Template Center, select the format according to the scenario, and then paste in the data.
- This is more time-saving than starting from a blank canvas and also makes it easier to fit the platform dimensions.
- For occasions requiring PPT, prioritize native PPT export.
- Before exporting, check the brand's main colors and conclusion text to avoid inconsistencies between charts and the report's presentation standards.
- The official states that it supports multi-round revision and optimization.
- For important reports, it is recommended to make minor adjustments in rounds rather than regenerate the whole repeatedly.
- Before uploading enterprise operation data, please check the platform's data and account terms first, and be cautious when uploading sensitive or customer data.
- The scope of templates and site rules may be adjusted.
- The authorization scope for external release or commercial use shall be subject to the official instructions, and shall be verified again before release.
Traffic & popularity
Data month Sep 2026
Aichart receives about 813 visits per month and ranks #18,811,862 worldwide.
Monthly visits
12 monthsTraffic sources
- Direct40.0%
- Search35.3%
- Referrals13.5%
- Social4.4%
- Display ads2.7%
- Other4.1%
Top countries
- China67.6%
- United States15.4%
- Taiwan, China14.6%
- Hong Kong, China2.5%
Estimated from third-party traffic data.
Similar tools
 Graph MakerAn AI charting tool that works with natural language: upload a CSV or table and then ask questions directly. The official states that it can generate bar charts, scatter plots, pie charts, histograms, and line charts, and also declares that it does not store data.
 Julius AIAn AI workspace for knowledge workers that connects to databases, analyzes data, and generates reports, presentations, charts, and multimodal content in natural language. It supports data sources such as Postgres and Snowflake and has obtained SOC 2 certification.
 InfogramA data visualization tool under Prezi, it can create interactive charts, maps, infographics and reports, supports embedding and sharing, and its official website states that the entire process from charts to infographics can be assisted by AI.
 NapkinA visualization tool that turns text into graphics. Paste a piece of content to generate flowcharts, mind maps, infographics and data charts. It supports exporting to formats compatible with presentations, web pages and documents, and is used for adding illustrations to reports, blogs and instruction documents.
 DocuopiaAn AI writing tool for product and documentation teams, officially said to produce requirement documents, help centers and wikis in minutes, supporting real-time collaboration, version management and AI-generated charts.
 SciDraw AISciDraw AI is an AI scientific illustration and data visualization platform for researchers. Officially, it can generate paper-level illustrations from text or sketches, supports plotting with CSV data and editable export in SVG/PPTX formats, and is compatible with the submission specifications of mainstream journals.