


SciDraw AI
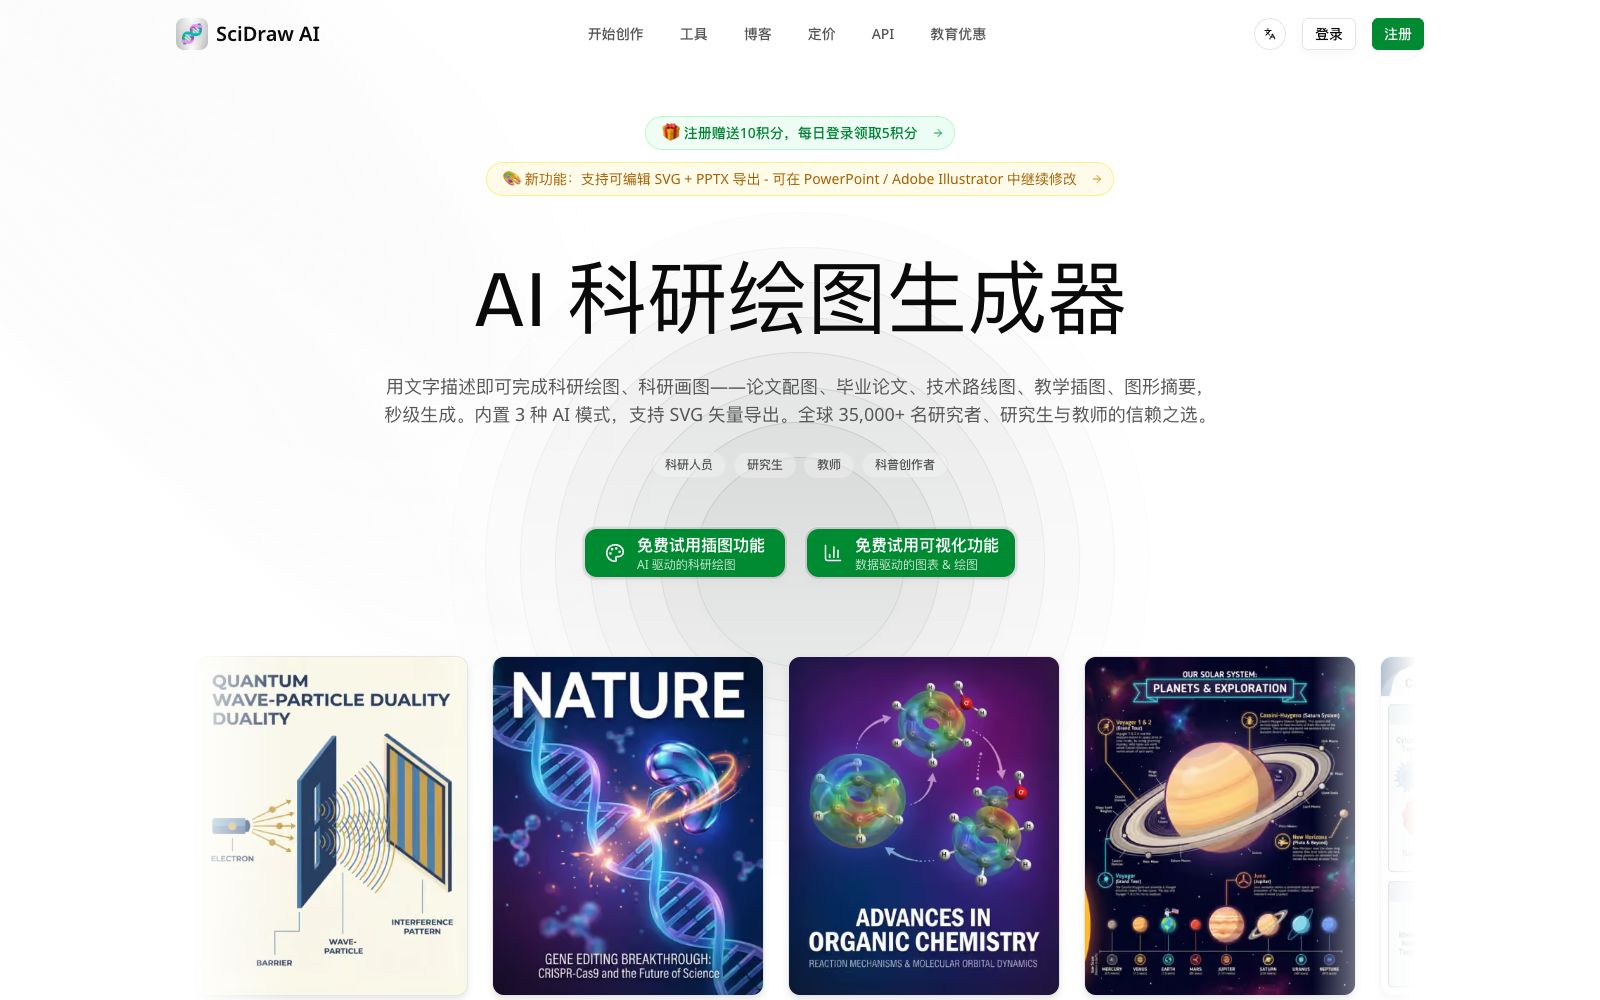
SciDraw AI is an AI scientific illustration and data visualization platform for researchers. Officially, it can generate paper-level illustrations from text or sketches, supports plotting with CSV data and editable export in SVG/PPTX formats, and is compatible with the submission specifications of mainstream journals.
Updated: 2026-10-26
What is SciDraw AI?
The official website of SciDraw AI defines itself as a platform for "publication-ready scientific illustrations & data visualizations", meaning it uses AI to generate scientific illustrations and data visualizations that can be directly used for publication. Its target audience is clearly defined: researchers, graduate students, educators, and science communicators. The website states that it already has over 35,000 researchers, students, and educators using it. Unlike general text-to-image tools, it focuses on editable vector exports and journal specifications.
Who is it for?
- PhD candidates and graduate students: Those who need to turn experimental results and research routes into paper illustrations, journal covers or graphical abstracts.
- University teachers and educators: They need to create annotated diagrams for course handouts and teaching posters, such as cross-sections of plant cells and food webs.
- Researchers and laboratory teams: Authors who need to create figures in accordance with the journal standards of Nature, Science and other journals and submit vector files.
- Science communication and popular science editors: People who translate professional content such as the principles of mRNA vaccines and the mechanisms of CRISPR into easy-to-understand infographics.
Key features
6Text-to-image
The official states that it can generate scientific illustrations from textual descriptions.
Sketch refinement
The official states that it can convert hand-drawn sketches into final-grade images.
Data Visualization
The official claims that it can generate paper-level charts from CSV/Excel files, automatically generate Python matplotlib/seaborn code, and support more than 10 chart types such as box plots, scatter plots, heatmaps, and regression plots.
Editable Export of SVG/PDF
The official version states that editable vector graphics can be exported for journal use; SVG files can also be exported for further refinement in Illustrator or Figma, or PPTX files can be exported to directly modify labels in PowerPoint.
Journal Specifications and Templates
Officially supports the journal standards of Nature, Science, Cell, PLOS and ACS, with 7+ built-in templates (including Table of Contents (TOC) graphics, journal covers and mechanism diagrams) and 6+ visual styles.
Three Generation Modes & Toolchain
The official states that it offers 3 AI generation modes, allowing for multi-round dialogue to refine labels, colors, and layouts; it also includes 46 chart tools as well as scientific and teaching templates.
How to use SciDraw AI
- Distinguish between two workflows: use text-to-image or sketch refinement for illustrations, and use Data Visualization to upload CSV/Excel for data visualizations.
- do not force statistical charts in illustration mode.
- Before submission, import the SVG or PPTX into Illustrator or PowerPoint to manually tweak the labels and color schemes.
- the official designed this workflow specifically with "editable" in mind.
- Using journal presets and color-blind friendly color schemes can reduce revision rounds, but the final size, font, and resolution must be checked against the requirements of the target journal.
- Pricing is based on credits.
- The official states that new users receive 10 free credits upon registration, and an additional 5 credits are awarded daily.
- A standard 2K prompt and custom generation consume 5 credits, with different consumption amounts for different modes.
- The official statement indicates that public REST APIs, MCP services, webhooks, SDKs, or CLIs are not currently available, so automation requirements can only be met through the web interface.
- the copyright and invoicing rules for generated images should be confirmed in accordance with the official website's FAQ and the latest terms.
Traffic & popularity
Data month Sep 2026
SciDraw AI receives about 63.8K visits per month and ranks #669,656 worldwide.
Monthly visits
12 monthsTraffic sources
- Search69.6%
- Direct19.6%
- Referrals7.0%
- AI assistants2.6%
- Social0.5%
- Other0.7%
Top countries
- United States23.1%
- China9.2%
- Taiwan, China6.0%
- Colombia4.5%
- United Kingdom4.5%
Estimated from third-party traffic data.
Similar tools
 PicDocAI Text Visualization Assistant: One-click conversion of text, papers and manuscripts into scientific research drawings, infographics and PPTs. Officially stated to support SCI journal specifications and 4K high-definition export, suitable for scientific research and educational scenarios.
 BiorenderA scientific diagram software for scientific research scenarios, featuring an AI diagram generation assistant and an icon library. It allows the creation of data charts, schematic diagrams and slides on the same platform, and the official claims that no design skills are required.
 Graph MakerAn AI charting tool that works with natural language: upload a CSV or table and then ask questions directly. The official states that it can generate bar charts, scatter plots, pie charts, histograms, and line charts, and also declares that it does not store data.
 FigEditorFigEditor is an AI generator for scientific research graphics. It can generate flowcharts, mechanism diagrams and data charts starting from prompt words, sketches or reference images. The official website supports revising labels, arrows, modules, colors and layouts of selected areas, and exports editable vector graphics or high-definition images.
 PageOn.AIPageOn.AI is an AI presentation and infographic creation tool. It uses AI agents to help you research, plan and design your target into an interactive visual story. It supports real-time data visualization, geonarrative and vector animation, going beyond static slides.
 AichartAichart is an AI-driven visual content creation platform positioned as a "chart agent" with in-depth editing capabilities. It covers templates such as charts, PPTs, dashboards and long images, suitable for scenarios like reports, assignments and data dissemination.