


Visme
A visual content platform integrating presentations, interactive infographics, design and video, with a built-in AI design assistant. Its official website emphasizes that users without any design foundation can also create professional content and branded materials.
Updated: 2026-10-26
What is Visme?
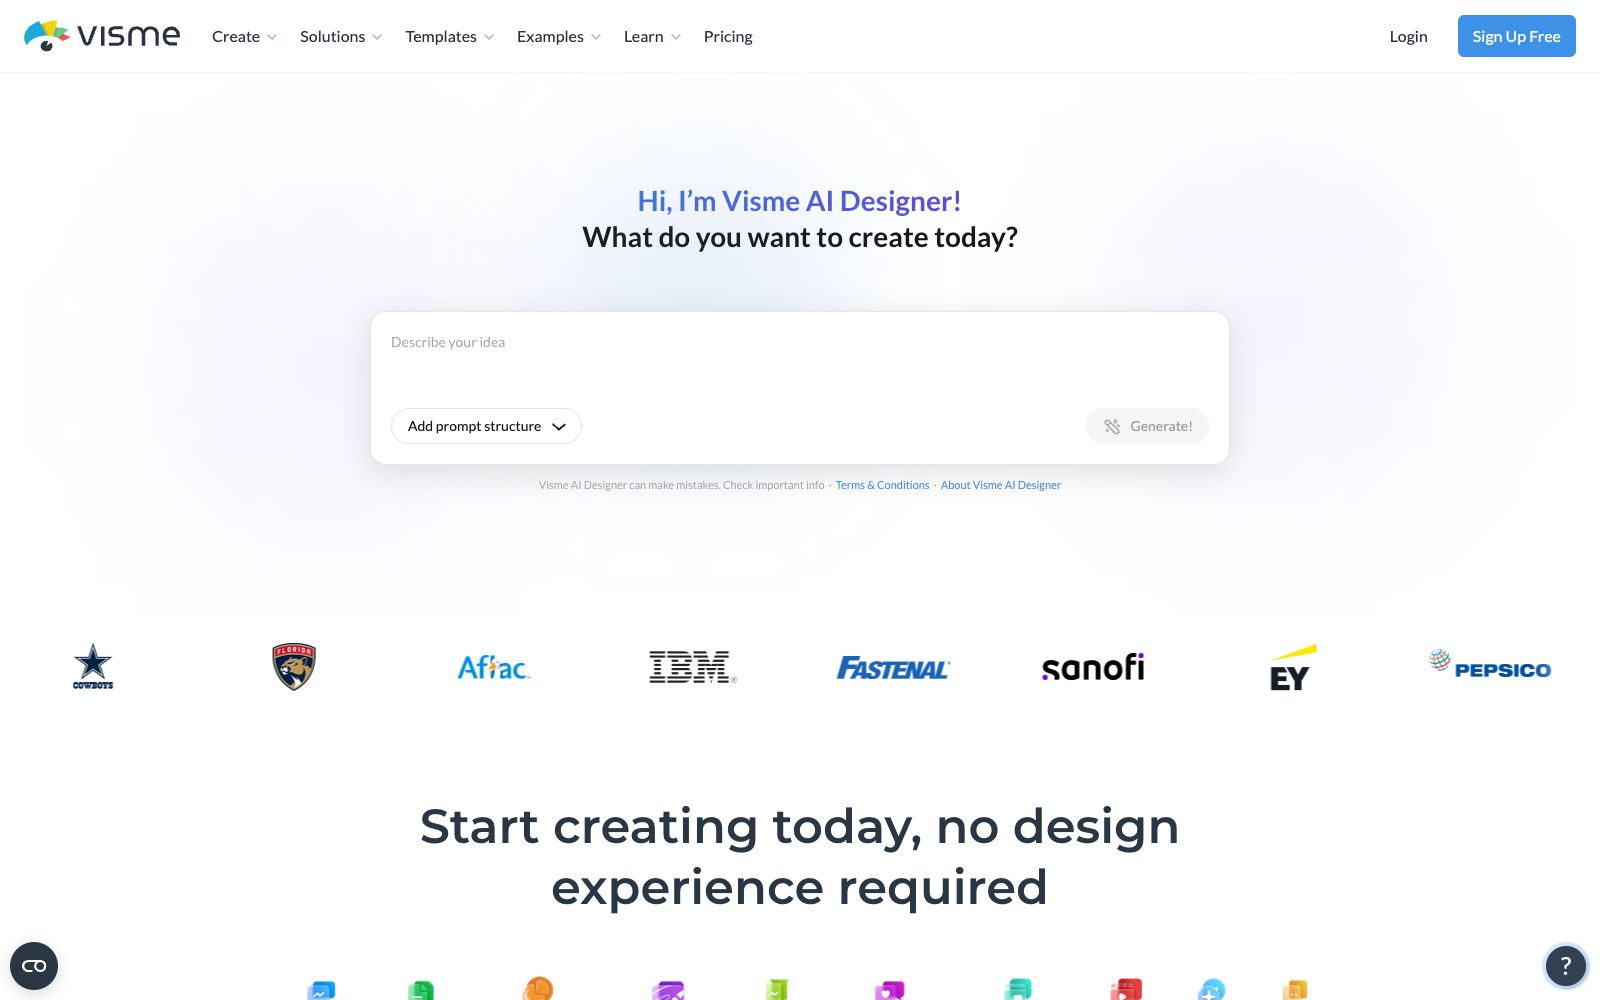
Visme is a visual content platform that brings together presentations, documents, data visualizations, social media graphics, videos, and wireframes in one place. Its official website states that it is used by over 35 million businesses and creators. Its homepage entry is an assistant called Visme AI Designer, which focuses on "no design experience required": you first clarify what you want to create today, and then the AI provides an editable first draft. Unlike tools that only handle presentations, Visme positions itself as an AI content system for teams, where creation, collaboration, and distribution are all completed within one account, and brand guidelines and material resources are centrally managed. According to its official website, it helps teams maintain consistency when scaling output.
Who is it for?
- Enterprise marketing teams that need to consistently produce branded presentations, reports, and proposals
- Operations and sales teams who frequently turn business data into charts but are not familiar with design software
- Content teams that require multi-person collaboration, unified asset management, and version control
- Education and human resources teams that create course and training materials and want to add interactivity and animations
- Small teams that need to create social media graphics, documents, and short videos simultaneously and don't want to switch between multiple tools
Key features
7Visme AI Designer
Featured as the main homepage entry on the official website, it generates ready-to-use initial design drafts through a conversational approach, which can then be refined in the editor.
Data Visualization
Converts statistical figures and business indicators into charts and graphs, which the official website says can turn numbers into attractive visual presentations.
Multi-format content
The content types listed on the official website include presentations, documents, data visualizations, social media graphics, videos, as well as wireframes and prototypes. There are also access points for documents, whiteboards, infographics, forms, and questionnaires.
Customizable Templates
Offers thousands of customizable templates covering various industries and use cases, eliminating the need to design layouts from scratch.
Interactivity and Animation
Supports adding interactive effects and animations to content, which, according to the official website, helps enhance audience engagement.
Branding & Collaboration
The official website states that it enables end-to-end brand content creation in a shorter time, supports team collaboration, precise communication, and asset management, as well as content creation, scheduling, and publishing all in one place.
Asset Library
Offers millions of images and icons, which the official website states help make works stand out from generic materials.
How to use Visme
- It is recommended to first use AI Designer to generate an initial version framework, confirm the layout and information hierarchy, and then replace it with your own data and copy.
- This is usually faster than modifying the template directly.
- For teams with brand requirements, first set up the logo, color matching and font configuration, and all subsequent materials will automatically follow the same set of specifications.
- For content that needs to be distributed externally, you can use the in-site creation, scheduling and release processes to link the output and delivery in a single line, reducing back-and-forth exports.
- The official website displays enterprise cases such as IBM and Broncos.
- Before purchasing, you can compare your own scenarios to judge the adaptability.
- the specific package functions and differences in collaboration seats shall be subject to the instructions on the official website's corresponding page.
- The scale of materials and templates is large, so it is recommended to create directories by project for classification to avoid excessive retrieval costs in the later stage.
- For images and fonts involved in commercial release, pay attention to verifying the authorization scope.
Traffic & popularity
Data month Sep 2026
Visme receives about 336.0K visits per month and ranks #140,843 worldwide.
Monthly visits
12 monthsTraffic sources
- Search58.1%
- Direct28.9%
- Referrals7.0%
- Social2.2%
- Mail1.9%
- Other1.8%
Top countries
- United States22.8%
- India8.9%
- Russia6.5%
- Brazil4.8%
- Philippines3.4%
Estimated from third-party traffic data.
In these collections
Similar tools
 PiktochartA veteran infographic and data visualization design platform, its official website states that it serves 34 million users. It offers Pikto AI Studio, which can quickly transform data into infographics, presentations, reports, e-books and videos without any design background.
 InfogramA data visualization tool under Prezi, it can create interactive charts, maps, infographics and reports, supports embedding and sharing, and its official website states that the entire process from charts to infographics can be assisted by AI.
 PicDocAI Text Visualization Assistant: One-click conversion of text, papers and manuscripts into scientific research drawings, infographics and PPTs. Officially stated to support SCI journal specifications and 4K high-definition export, suitable for scientific research and educational scenarios.
 ChatPPTChatPPT is a team-oriented AI presentation workbench that supports one-click classic generation and Agent collaboration. It can generate well-structured PPTs from themes, documents, web pages and images, making it suitable for business and brand presentations.
 PageOn.AIPageOn.AI is an AI presentation and infographic creation tool. It uses AI agents to help you research, plan and design your target into an interactive visual story. It supports real-time data visualization, geonarrative and vector animation, going beyond static slides.RhetisAI Presentation Workbench, officially said to organize uploaded documents, spreadsheets and existing slides into a narrative structure and editable PPT. The agent is responsible for extracting claims, organizing page order and layout, and it is currently in the Beta stage.