


Napkin
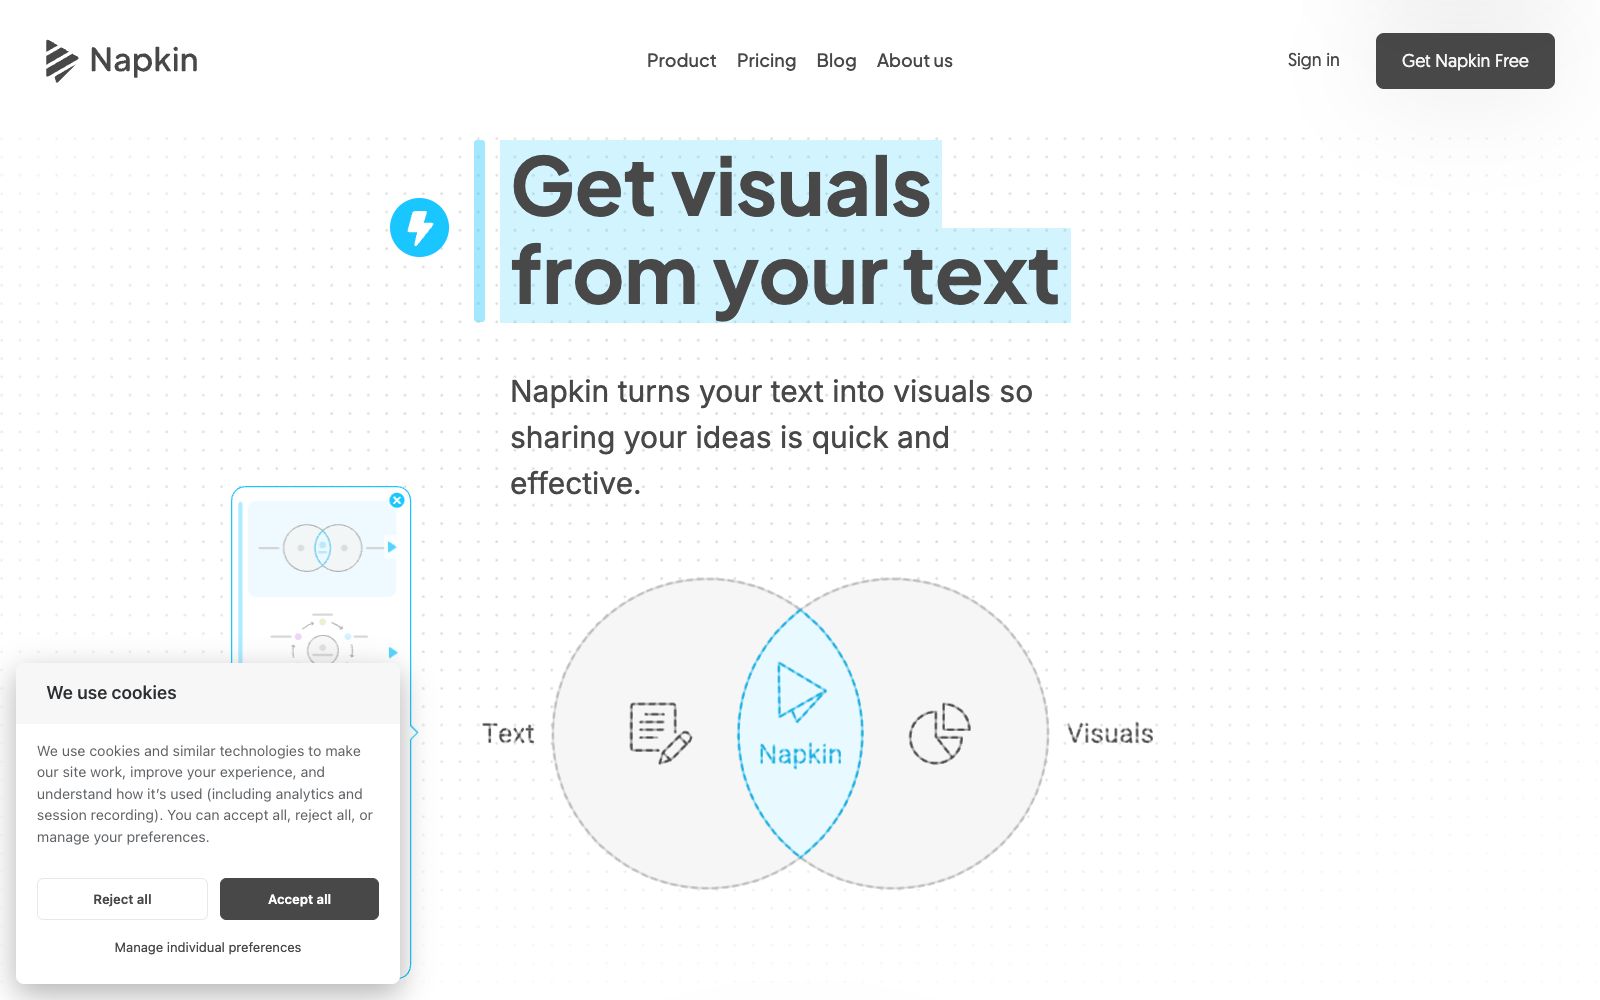
A visualization tool that turns text into graphics. Paste a piece of content to generate flowcharts, mind maps, infographics and data charts. It supports exporting to formats compatible with presentations, web pages and documents, and is used for adding illustrations to reports, blogs and instruction documents.
Updated: 2026-10-26
What is Napkin?
The bottleneck of many documents isn't writing, but creating illustrations. Napkin is designed to solve exactly this problem: paste a piece of text into it, and it will directly generate flowcharts, mind maps, infographics, and data charts. You just pick one that looks good and then revise it. The official promotion emphasizes that you don't need to know design, nor do you have to write prompts—you don't need to learn how to "talk" to AI; just paste your draft over. This is especially friendly for technical writers, because structure inherently grows out of text. The official also specifically cites feedback from a project manager and a professor, talking about how they use it for presentations and create illustrations for articles—it sounds like they see it as a tool to "quickly turn ideas into something presentable to others," rather than a stripped-down version of professional drawing software.
Who is it for?
- Technical writers who need to add flowcharts and architecture diagrams to blog posts and official WeChat accounts.
- Team members who struggle with full-page PPTs that only contain text during presentations.
- Lecturers and operations personnel who need to quickly create structural diagrams for teaching and training content.
- Office workers who don't know how to use professional drawing software and are unwilling to settle for default graphics.
- Content teams who have ready-made long texts and need to complete all illustrations within a few hours.
Key features
6Generate graphics directly from text
After pasting or importing text, it automatically generates a variety of graphics, and you can select the most suitable one from the options.
Covers common needs for graphic types
Flowcharts, mind maps, infographics, charts, and slides are all on the official list.
Content can be edited and generated continuously
The official stated that all content is not fixed and can be modified until satisfaction.
Export in Four Formats
It supports exporting to PPT, PNG, PDF, and SVG, so you don’t need to redo it when pasting into presentations or documents.
Entry by Scenario
The official directly categorizes usage scenarios into four types: presentations, blogs, social media, and documents.
Q&A section covers common concerns
The official website lists questions such as whether it is free, whether edits can be made after modification, and whether it supports mobile devices.
How to use Napkin
- 1Try the free entry on the official website first, and decide whether to continue investing only if it meets your needs. The FAQ specifically answers the question of whether it is free.
- 2Delete all redundant text before pasting; the cleaner the input text, the closer the generated graph will be to the structure you truly want to express.
- 3Be sure to make manual edits before exporting: the color scheme, font size and terminology will most likely need to be aligned with your brand and writing style.
- 4You must double-check the figures for external release; a good-looking figure does not mean accurate data, which is where mistakes are most likely to happen.
- 5There is a description of team collaboration on the official website. First confirm whether multiple people need to use it together, and then decide which solution to adopt.
Traffic & popularity
Data month Sep 2026
Napkin receives about 2.6M visits per month and ranks #17,828 worldwide.
Monthly visits
12 monthsTraffic sources
- Search44.8%
- Direct42.5%
- Social4.5%
- Referrals3.2%
- AI assistants3.1%
- Other1.9%
Top countries
- India14.4%
- Mexico6.3%
- United States6.0%
- France5.5%
- South Korea4.7%
Estimated from third-party traffic data.
Similar tools
 DocuopiaAn AI writing tool for product and documentation teams, officially said to produce requirement documents, help centers and wikis in minutes, supporting real-time collaboration, version management and AI-generated charts.
 AichartAichart is an AI-driven visual content creation platform positioned as a "chart agent" with in-depth editing capabilities. It covers templates such as charts, PPTs, dashboards and long images, suitable for scenarios like reports, assignments and data dissemination.
 AyoaAI mind map and task management tool that organizes ideas with organic mind maps and directly converts them into to-do items. The interface has been optimized for people with ADHD and dyslexia, and it's free to create up to 10 mind maps.
 MyMap.AIMyMap.AI is an infinite canvas that grows with your conversations. Just speak your ideas, and it will automatically generate mind maps, flowcharts, or analysis matrices. Select a node and say a sentence to modify it, and you can also frame content to export as slides.
 PicDocAI Text Visualization Assistant: One-click conversion of text, papers and manuscripts into scientific research drawings, infographics and PPTs. Officially stated to support SCI journal specifications and 4K high-definition export, suitable for scientific research and educational scenarios.
 Graph MakerAn AI charting tool that works with natural language: upload a CSV or table and then ask questions directly. The official states that it can generate bar charts, scatter plots, pie charts, histograms, and line charts, and also declares that it does not store data.