


Graph Maker
An AI charting tool that works with natural language: upload a CSV or table and then ask questions directly. The official states that it can generate bar charts, scatter plots, pie charts, histograms, and line charts, and also declares that it does not store data.
Updated: 2026-10-26
What is Graph Maker?
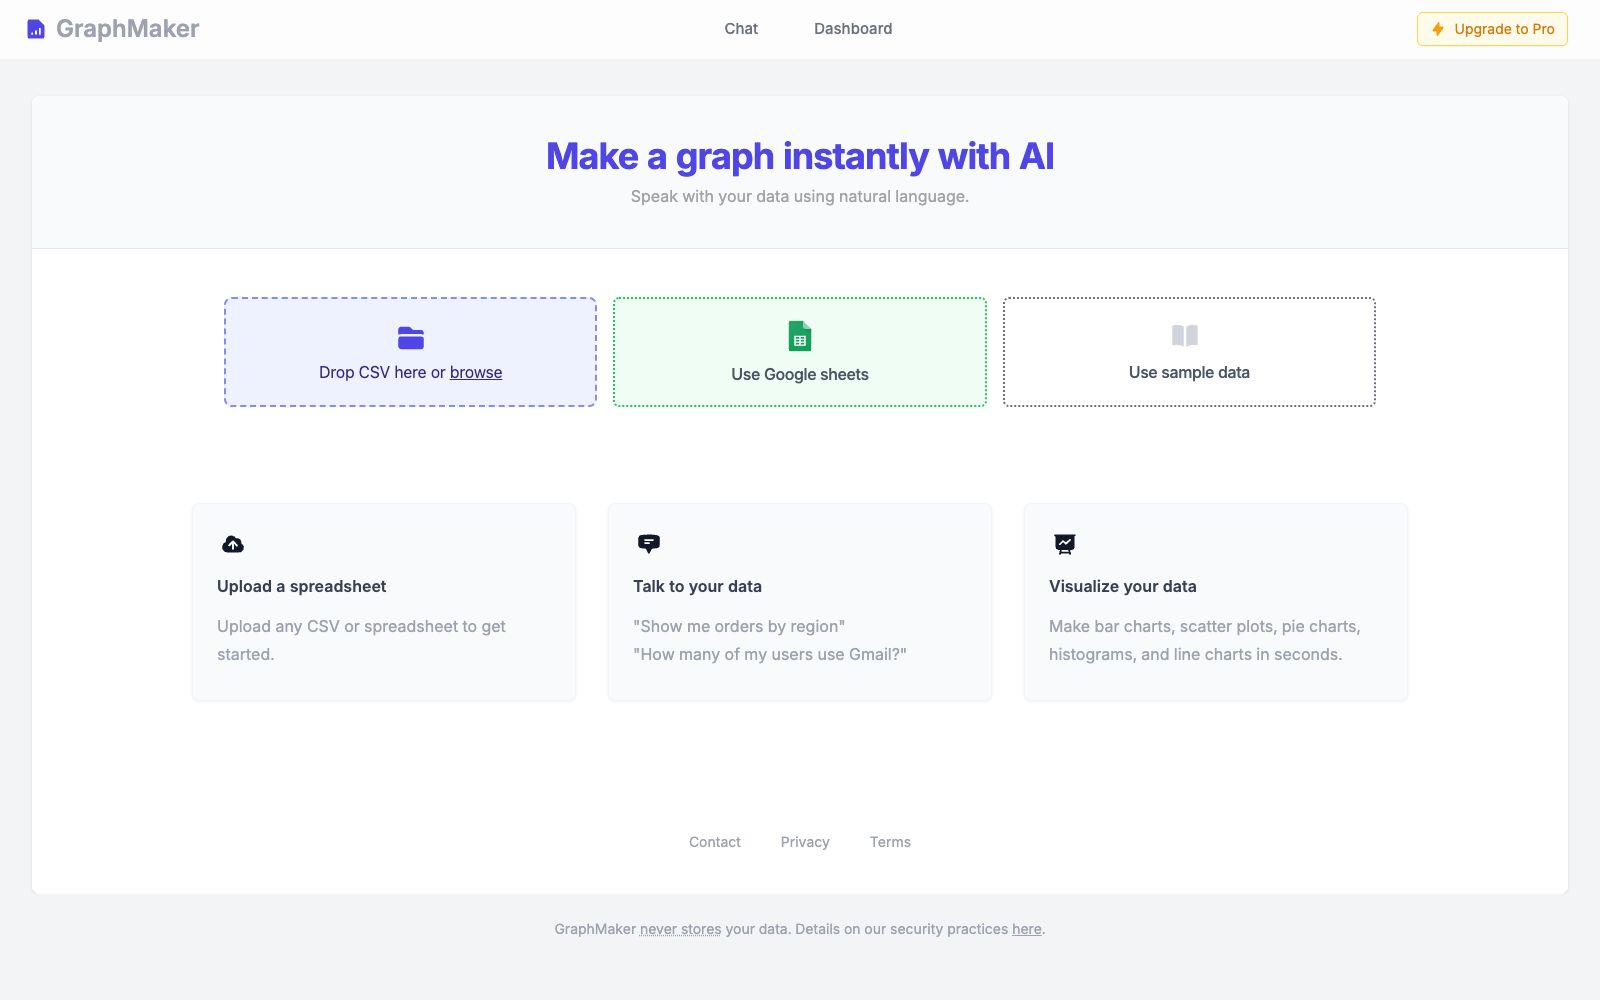
GraphMaker's official website title is "Make any chart in seconds with AI", and the slogan on the homepage is "Make a graph instantly with AI". Its positioning is narrow and easy to understand: you don't need to learn chart configuration. Just upload a spreadsheet or use sample data, connect to Google Sheets, and then ask questions in a conversational way, such as "Show order volume by region", and the chart will be generated immediately.
Who is it for?
- Operations personnel who need to temporarily create a chart for presentation materials and don't want to open BI tools.
- Small and medium-sized enterprise owners who want to quickly view the distribution after organizing survey or sales data.
- Teachers who need to demonstrate data visualization to students in class.
- Content creators who write articles or run self-media and need to pair clean charts with their work.
- Regular users who are unfamiliar with Excel chart settings and prefer to use voice commands instead of manual operations.
Key features
6Talk to your data
The official website states that you can converse with your data using natural language, and the example on the page is "Show me orders by region".
Upload a spreadsheet
Supports uploading any CSV or spreadsheet file to start analysis.
Use Google sheets / sample data
You can directly connect to Google Sheets, or use sample data to experience it first.
Diverse chart types
The official version states that it can generate bar charts, scatter plots, pie charts, histograms, and line charts.
No data storage
Clearly stated in the footer of the official website that "GraphMaker never stores your data".
Upgrade to Pro
An in-app upgrade entry for Pro is available to unlock more usage limits or capabilities.
How to use Graph Maker
- 1Familiarize yourself with the querying method using sample data first, then upload your own spreadsheet to avoid many detours.
- 2Try to include clear dimensions and metrics in your questions. For example, "Count sales by month" will make it easier to get the chart you want than "Take a look at sales".
- 3Make the header row clear and remove merged cells before uploading to significantly improve recognition accuracy.
- 4Although the official website states that it does not store your data, it is still recommended that you perform desensitization first when dealing with customer lists or financial details.
- 5The feature boundaries between the Free version and Pro may be adjusted; please refer to the official website's pricing page for the latest details before long-term use.
Traffic & popularity
Data month Sep 2026
Graph Maker receives about 7.2K visits per month and ranks #3,414,718 worldwide.
Monthly visits
12 monthsTraffic sources
- Direct40.5%
- Search33.5%
- Referrals10.2%
- Social6.4%
- Mail3.1%
- Other6.3%
Top countries
- United States30.0%
- Brazil18.5%
- India13.1%
- United Kingdom8.1%
- Malaysia6.9%
Estimated from third-party traffic data.
Similar tools
 AichartAichart is an AI-driven visual content creation platform positioned as a "chart agent" with in-depth editing capabilities. It covers templates such as charts, PPTs, dashboards and long images, suitable for scenarios like reports, assignments and data dissemination.
 QuadraticQuadratic is a workbench that embeds AI into spreadsheets. It connects to data sources such as CSV and databases, generates formulas, code and charts in natural language, and delivers reusable insights.
 Julius AIAn AI workspace for knowledge workers that connects to databases, analyzes data, and generates reports, presentations, charts, and multimodal content in natural language. It supports data sources such as Postgres and Snowflake and has obtained SOC 2 certification.
 Columns AIColumns AI offers a three-part data automation suite designed to streamline your workflow: Drive converts files into structured data, Flow lets you build automations using natural language, and Graph generates embeddable, branded visualizations you can share with your audience.
 InfogramA data visualization tool under Prezi, it can create interactive charts, maps, infographics and reports, supports embedding and sharing, and its official website states that the entire process from charts to infographics can be assisted by AI.
 SciDraw AISciDraw AI is an AI scientific illustration and data visualization platform for researchers. Officially, it can generate paper-level illustrations from text or sketches, supports plotting with CSV data and editable export in SVG/PPTX formats, and is compatible with the submission specifications of mainstream journals.