


RowSpeak
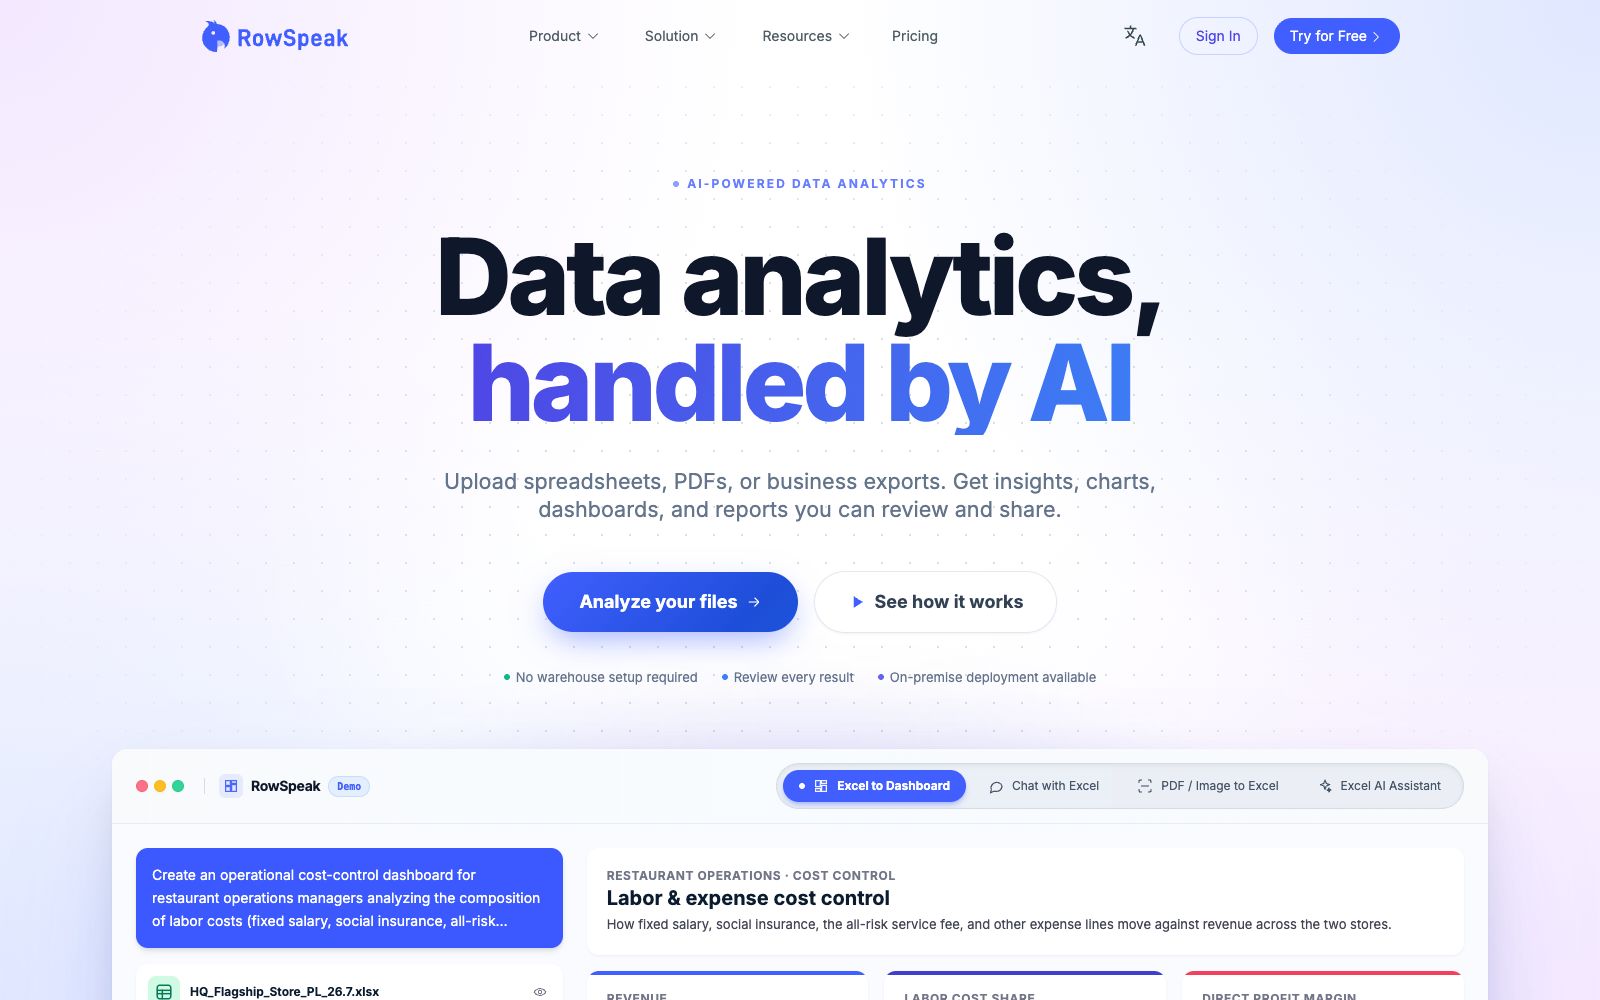
RowSpeak is an AI data analysis platform for sources such as Excel, CSV, and PDF. It can analyze tables, clean data, generate charts and interactive dashboards with natural language, and support converting images/PDFs to Excel.
Updated: 2026-10-26
What is RowSpeak?
RowSpeak is an AI data analysis and spreadsheet processing platform that caters to tabular data from various sources such as Excel, CSV, and PDF. It enables users to perform analysis, cleaning, visualization, and reporting using natural language, quickly transforming messy spreadsheets into readable insights and dashboards. It consolidates the data extraction, cleaning, and chart creation workflows scattered across multiple software into a conversational interface.
Who is it for?
- Business professionals who need to quickly convert messy spreadsheets into charts and dashboards and lack a dedicated data team.
- Data processors who frequently work with PDF or image-based spreadsheets and want to eliminate manual data entry to accelerate digitalization.
- Teams that don’t want to learn complex BI tools but need to perform basic analysis and visualization can use conversations instead of tedious configurations.
Key features
5Excel AI
Directly analyze Excel files, automatically create dashboards and generate reports, lowering the threshold for analysis. There is no need to move data between multiple tools first; you can get preliminary conclusions immediately after uploading.
AI Spreadsheet Assistant
Perform spreadsheet operations through natural language, such as sorting, filtering, and summarizing. There is no need to write functions manually, and business personnel can also independently complete routine data processing.
Data Analysis & Cleaning
Provides advanced statistical analysis, and uses natural language to fix duplicates, formatting issues, and blank cells, turning messy data into a usable state and reducing manual sorting time.
Image/PDF to Excel
Convert tables in images or PDF documents into editable Excel spreadsheets with one click, reducing manual data entry. Ideal for digitizing paper documents or scanned files, it improves the efficiency of data entry into databases.
Charts & BI
Built-in Graph Maker for generating charts, one-click Excel to Dashboard for creating interactive dashboards, and support for business intelligence insights to facilitate external reporting and decision-making.
How to use RowSpeak
- After uploading a file, first ask questions in natural language, such as "Summarize sales by month and create a chart", let the AI provide a first draft and then make adjustments, which is more efficient than starting from a blank canvas.
- When converting images or PDFs to Excel, ensure the source files are clear and well-formatted for higher recognition accuracy, and conduct a spot check after conversion.
- Conduct a basic review of the generated visualizations before external reporting to avoid misinterpretation caused by inconsistent metrics, and keep the raw data for key indicators for future reference.
- When faced with a raw table that has messy fields, numerous blank spaces and duplicate rows, it is often more prudent to first clean it up and identify the fields before proceeding to analysis, rather than creating charts directly.
- Clearly describing the cleaning rules in natural language, such as "delete completely blank rows and unify dates to YYYY-MM-DD", allows subsequent steps to be built on clean data.
Traffic & popularity
Data month Sep 2026
RowSpeak receives about 27.9K visits per month and ranks #674,665 worldwide.
Monthly visits
10 monthsTraffic sources
- Search60.1%
- Direct25.3%
- Referrals8.4%
- Social2.4%
- Mail1.3%
- Other2.5%
Top countries
- Japan58.0%
- South Korea21.0%
- Taiwan, China11.4%
- India9.5%
Estimated from third-party traffic data.
Similar tools
 Vizly AIAI data analysis assistant: After uploading a table, you can directly ask questions in natural language. It automatically generates visualizations, statistical analysis and prediction results, and can export reports to various formats such as Word and PDF.
 Tableau GPTA business intelligence and data analysis platform under Salesforce, it can connect to almost all databases and generate visualizations through drag-and-drop, and has integrated Agentic AI and conversational analysis (Tableau Agent) into its entire product line.
 ExcelMaster.aiExcelMaster.ai is a spreadsheet-oriented AI agent that can generate complex formulas using natural language, write and explain VBA macros, perform cell-level operations, and includes free tools such as built-in PDF/Word/Excel conversion functions.
 QuadraticQuadratic is a workbench that embeds AI into spreadsheets. It connects to data sources such as CSV and databases, generates formulas, code and charts in natural language, and delivers reusable insights.
 EndexEndex AI is an Excel-native AI agent specifically built for the financial industry, deeply embedded in the Excel sidebar, enabling analysts to complete financial modeling, DCF valuation and data cleaning within familiar spreadsheets in just a few minutes.
 Yuankong ChatExcelAn AI spreadsheet tool focused on "chat-controlled spreadsheets", its official website states that it can complete data cleaning, analysis and batch processing without formula functions, supports processing multiple files and worksheets, generating PPTs and dynamic lesson plans, and provides charts and dashboards.