


Quadratic
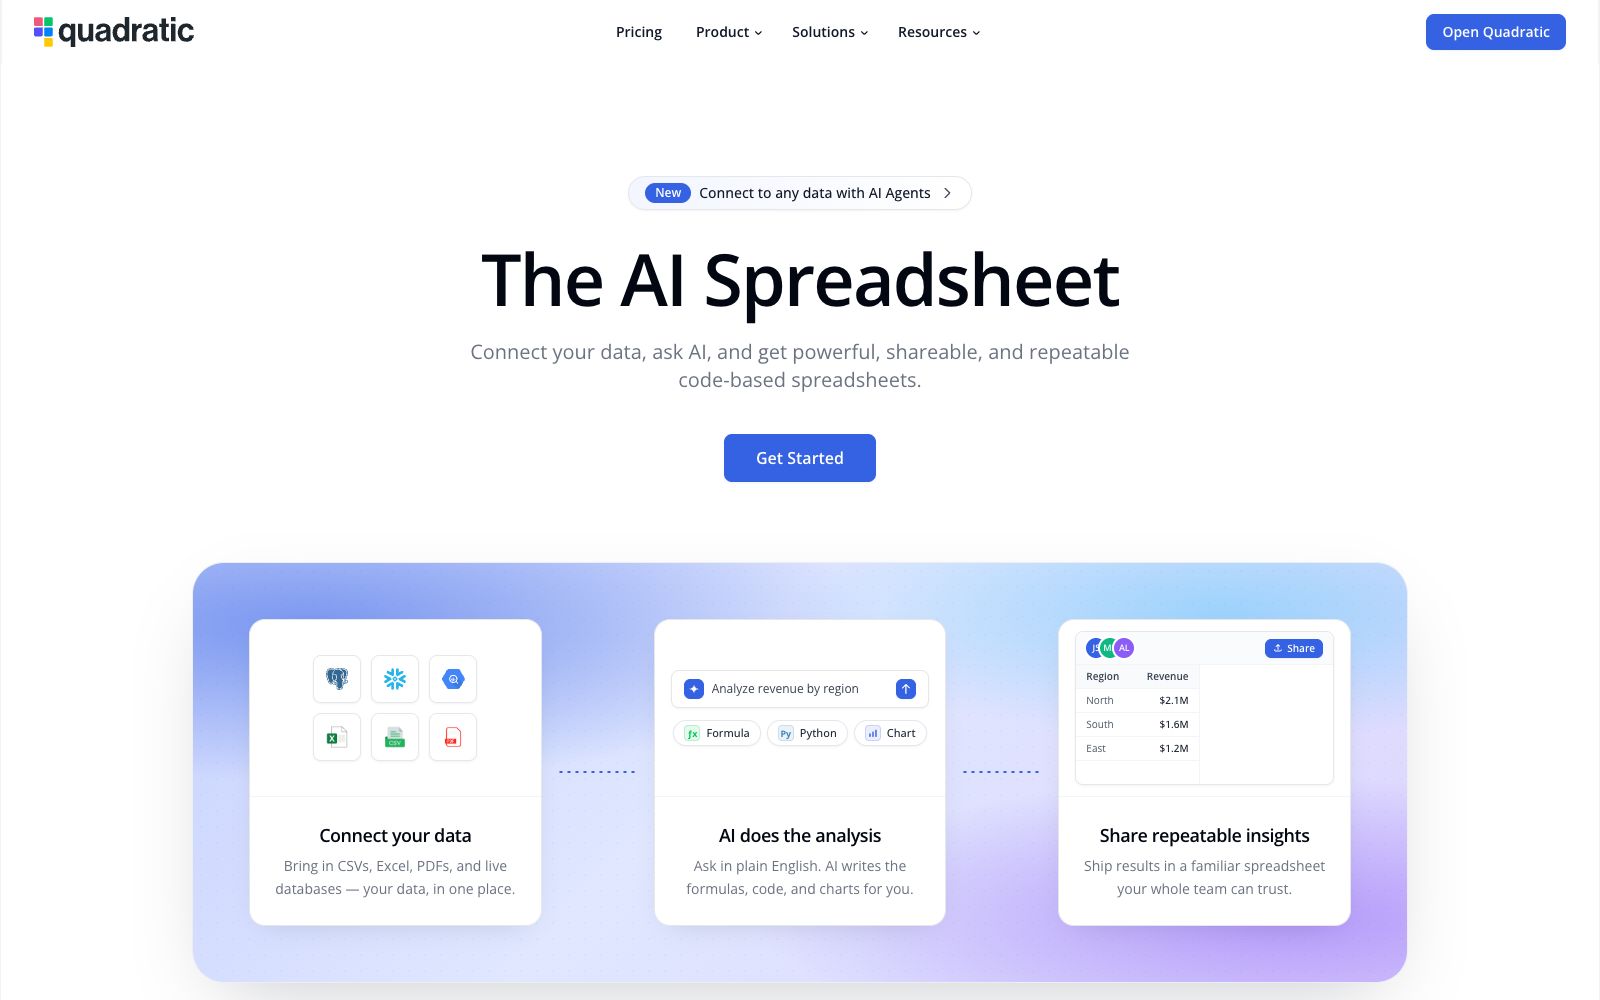
Quadratic is a workbench that embeds AI into spreadsheets. It connects to data sources such as CSV and databases, generates formulas, code and charts in natural language, and delivers reusable insights.
Updated: 2026-10-26
What is Quadratic?
Quadratic is a workspace that embeds artificial intelligence into spreadsheets, allowing you to connect data in natural language and quickly get interpretable conclusions. It supports CSV, Excel, PDF and real-time database connections. AI directly writes formulas, code and charts, eliminating the trouble of hand-writing complex functions. For individual analysts and teams, it aggregates scattered data sources into a shareable and reusable smart sheet, significantly lowering the threshold for analysis.
Who is it for?
- Analysts who use spreadsheets daily: Workplace data users who want to automate queries and reports and reduce the risk of errors in manual formulas.
- Finance and operations teams: Connect systems like QuickBooks to keep bookkeeping data live in spreadsheets and update in real time with the source data.
- Teams that need to handle multi-source data: Unify databases, files, and interfaces into a single analysis interface, saying goodbye to copy-pasting.
- People looking to lower the barrier: even without coding knowledge, they can perform data analysis by asking questions and quickly get readable conclusions.
- Startups and small businesses: Build an operation dashboard in a lightweight way without the need to purchase expensive data analysis platforms.
Key features
5Multi-source data integration: Import CSV, Excel, PDF and real-time databases into the same table for centralized management, eliminating the hassle of separate management and repeated exports.
Natural language analysis
Ask questions directly in Chinese or English, and the AI will help you write formulas, Python code, and charts, greatly reducing the threshold for use.
Replace complex functions
For hard-to-read and error-prone functions like VLOOKUP, you can have AI generate more verifiable Python logic to replace handwritten long formulas.
Reusable insights
Save analysis results into tables trusted by the team, refresh recurring reports with one click instead of redoing them each time, saving a lot of time.
Big Data & Agents
Designed for large-volume data, it allows connecting any agents and tools to the spreadsheet for collaborative work, expanding the boundaries of analysis.
How to use Quadratic
- 1Import familiar data first: Start with commonly used CSV or Excel files to experience the convenience of asking questions in natural language before connecting to complex data sources.
- 2Rewrite old formulas with AI: Hand long and hard-to-understand VLOOKUPs over to AI to convert them into clear code, making future maintenance and verification easier.
- 3Connect to real-time databases to build dashboards: Link your databases to have reports update automatically as the source data changes, reducing errors from manual synchronization.
- 4Save reusable tables: Solidify mature analyses into templates that the team can directly apply later, accumulating organizational knowledge.
- 5Verify AI Output: Check the code and citations generated by AI for key conclusions, and confirm they are correct before sharing them and making decisions.
Traffic & popularity
Data month Sep 2026
Quadratic receives about 352.2K visits per month and ranks #91,741 worldwide.
Monthly visits
12 monthsTraffic sources
- Search55.3%
- Direct31.8%
- Social6.4%
- Referrals4.6%
- Mail1.1%
- Other0.8%
Top countries
- India24.0%
- United States20.1%
- United Kingdom7.9%
- Russia3.5%
- Kenya2.6%
Estimated from third-party traffic data.
Similar tools
 Julius AIAn AI workspace for knowledge workers that connects to databases, analyzes data, and generates reports, presentations, charts, and multimodal content in natural language. It supports data sources such as Postgres and Snowflake and has obtained SOC 2 certification.
 RowSpeakRowSpeak is an AI data analysis platform for sources such as Excel, CSV, and PDF. It can analyze tables, clean data, generate charts and interactive dashboards with natural language, and support converting images/PDFs to Excel.
 Rows AIRows, a spreadsheet with built-in AI analysis capabilities, features the slogan "A cell is a prompt" on its official website: After typing an equal sign, describe your needs to generate formulas, charts and insights without requiring code, formulas or menu operations.
 Graph MakerAn AI charting tool that works with natural language: upload a CSV or table and then ask questions directly. The official states that it can generate bar charts, scatter plots, pie charts, histograms, and line charts, and also declares that it does not store data.
 ZettaZetta is an AI data analysis platform for business teams. Officially, it offers conversational AI data analysts, automated insights, visual dashboards and data warehouses, enabling businesses to gain clear insights into data without the need for a dedicated data team.
 SourcetableSourcetable is an AI-native spreadsheet designed for analysts and finance teams. It enables connections to databases and business applications without coding, and allows for querying, modeling, visualization and automated reporting using natural language.