


Vizly AI
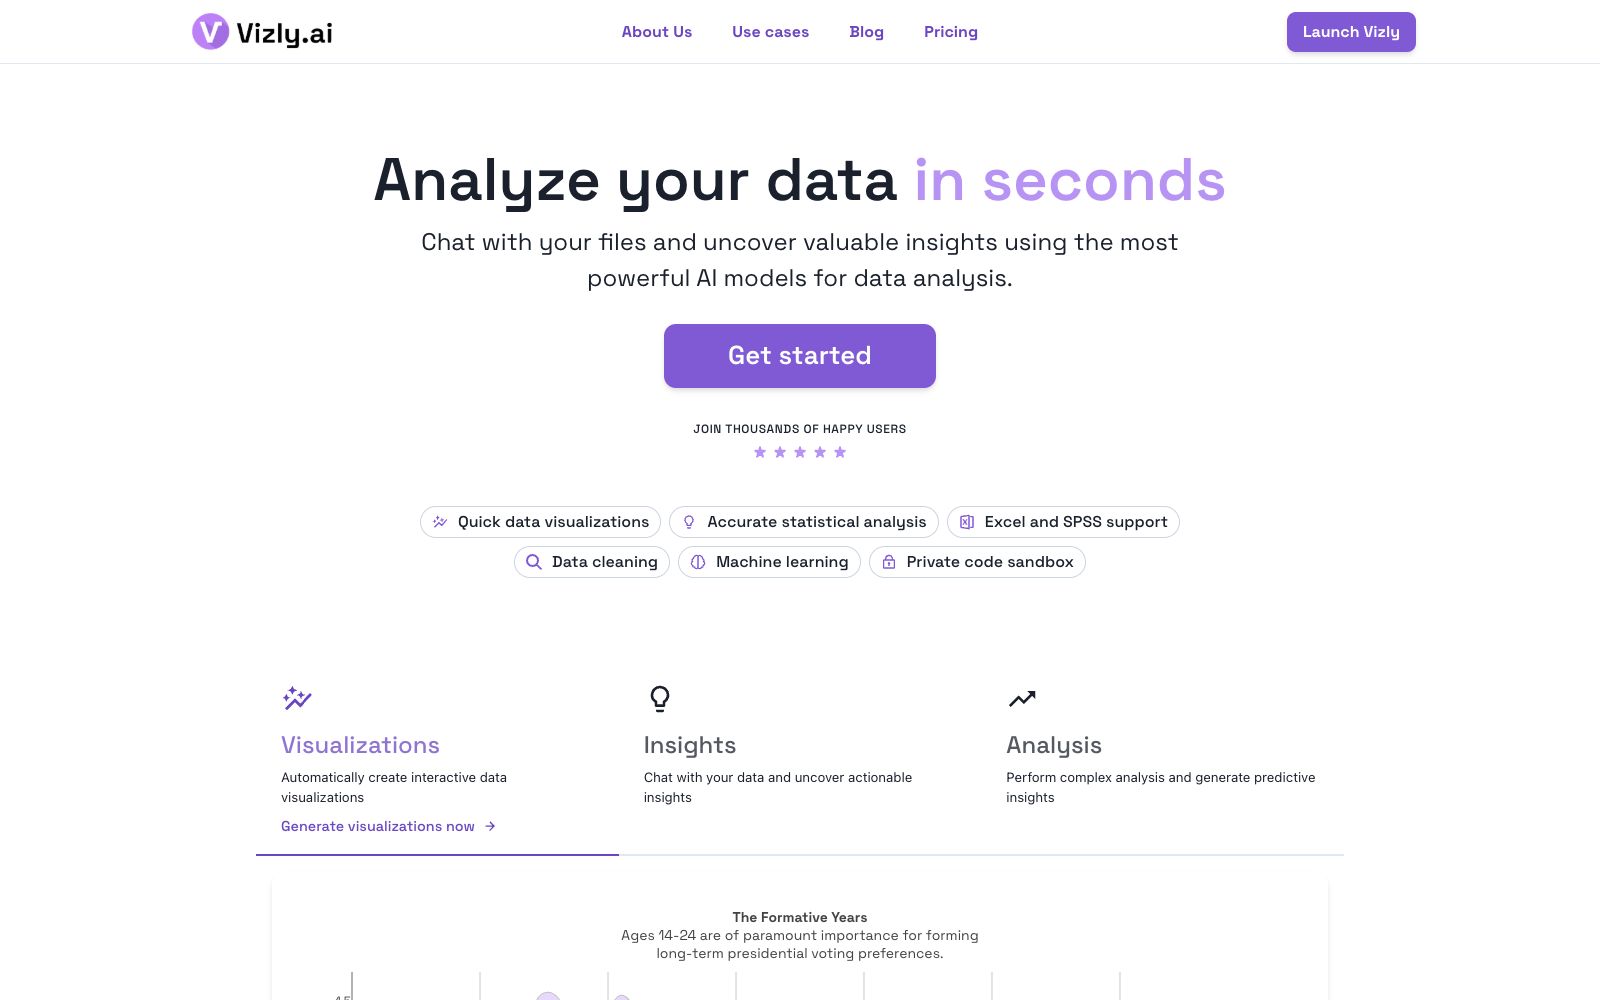
AI data analysis assistant: After uploading a table, you can directly ask questions in natural language. It automatically generates visualizations, statistical analysis and prediction results, and can export reports to various formats such as Word and PDF.
Updated: 2026-10-26
What is Vizly AI?
Vizly's official website positions itself as "Your AI Data Analyst". The usage method is to upload files and then ask questions in plain language; it automatically generates Python or R code to complete the analysis and provide conclusions. The official website outlines a four-step usage process: connect data, ask questions, gain insights, and share results. It targets both researchers and teachers, as well as data analysts and managers on the business side. The case section on the official website highlights three application scenarios: healthcare, finance, and genetic research.
Who is it for?
- Graduate students and teachers who can ask questions but do not know how to write Python and yet need to perform statistical analysis.
- Business analysts who need to quickly generate visualizations and report metrics to management.
- Data professionals conducting research in fields such as genetics and health who need to repeatedly run exploratory analyses.
- University professors who teach statistics and want their students to focus on interpretation rather than syntax.
- Project managers who need to package analysis results into reports and share them with colleagues.
Key features
6Visualizations
The official website states that it automatically generates interactive data visualization charts.
Insights
Engage in dialogue with data to uncover actionable insights.
Analysis
Perform complex analyses and predictive analytics.
Excel and SPSS support
The official claims to support common spreadsheet and statistical software formats.
Data cleaning and Machine learning
Two other capabilities listed on the official website.
Private code sandbox
The official statement says that code and files run in an isolated sandbox.
How to use Vizly AI
- Do basic field naming and organization before uploading.
- naming columns "Date" or "Amount" makes it more likely to get accurate results than using names like col1.
- The official website states that it can generate Python or R code.
- It is recommended to take a quick look at the code to confirm whether the statistical methods align with your research design.
- For sensitive data, check the retention policy before uploading: The official website states that data is stored in an isolated environment with encryption, permanently deleted after a period of inactivity, and paid users can set a longer retention period.
- Free tier is limited.
- First, clarify your questions using a small sample, then proceed with the full dataset.
- When dealing with regulated data such as healthcare and finance information, first verify the service provider's compliance qualifications.
- billing and quota rules may be adjusted, so please refer to the official website for the latest.
- **Let it generate suggestion questions first**: The official website states that it can automatically generate suggestion questions.
- If you're not sure where to start, run through these suggestions first, then adjust them to your own indicator definitions.
- **Choose the language based on team habits**: The official website states that it can generate Python or R code for you to choose from, and it is more convenient to select the one that your team can understand when you need to reproduce the analysis later.
Traffic & popularity
Data month Sep 2026
Vizly AI receives about 5.5K visits per month and ranks #4,763,375 worldwide.
Monthly visits
12 monthsTraffic sources
- Direct40.3%
- Search34.5%
- Referrals10.0%
- Social6.5%
- Display ads2.9%
- Other5.8%
Top countries
- India14.7%
- United States14.7%
- Vietnam14.0%
- Indonesia8.3%
- United Kingdom8.3%
Estimated from third-party traffic data.
Similar tools
 RowSpeakRowSpeak is an AI data analysis platform for sources such as Excel, CSV, and PDF. It can analyze tables, clean data, generate charts and interactive dashboards with natural language, and support converting images/PDFs to Excel.
 Tableau GPTA business intelligence and data analysis platform under Salesforce, it can connect to almost all databases and generate visualizations through drag-and-drop, and has integrated Agentic AI and conversational analysis (Tableau Agent) into its entire product line.
 AlgForce AIAlgForce AI is an AI data analysis and report generation platform. You can upload tables to generate data dashboards and analysis reports. The official claims that it can one-click generate multi-page reports, and it also provides MCP for Agent to call.
 ChatSPSSThe online statistical analysis tool launched by Chengdu Nature Intelligence Technology supports uploading CSV, Excel, SPSS and Stata data. According to the official website, it covers more than 27 statistical methods and automatically generates three-line tables and interpretations.
 Julius AIAn AI workspace for knowledge workers that connects to databases, analyzes data, and generates reports, presentations, charts, and multimodal content in natural language. It supports data sources such as Postgres and Snowflake and has obtained SOC 2 certification.
 ZettaZetta is an AI data analysis platform for business teams. Officially, it offers conversational AI data analysts, automated insights, visual dashboards and data warehouses, enabling businesses to gain clear insights into data without the need for a dedicated data team.