


FigEditor
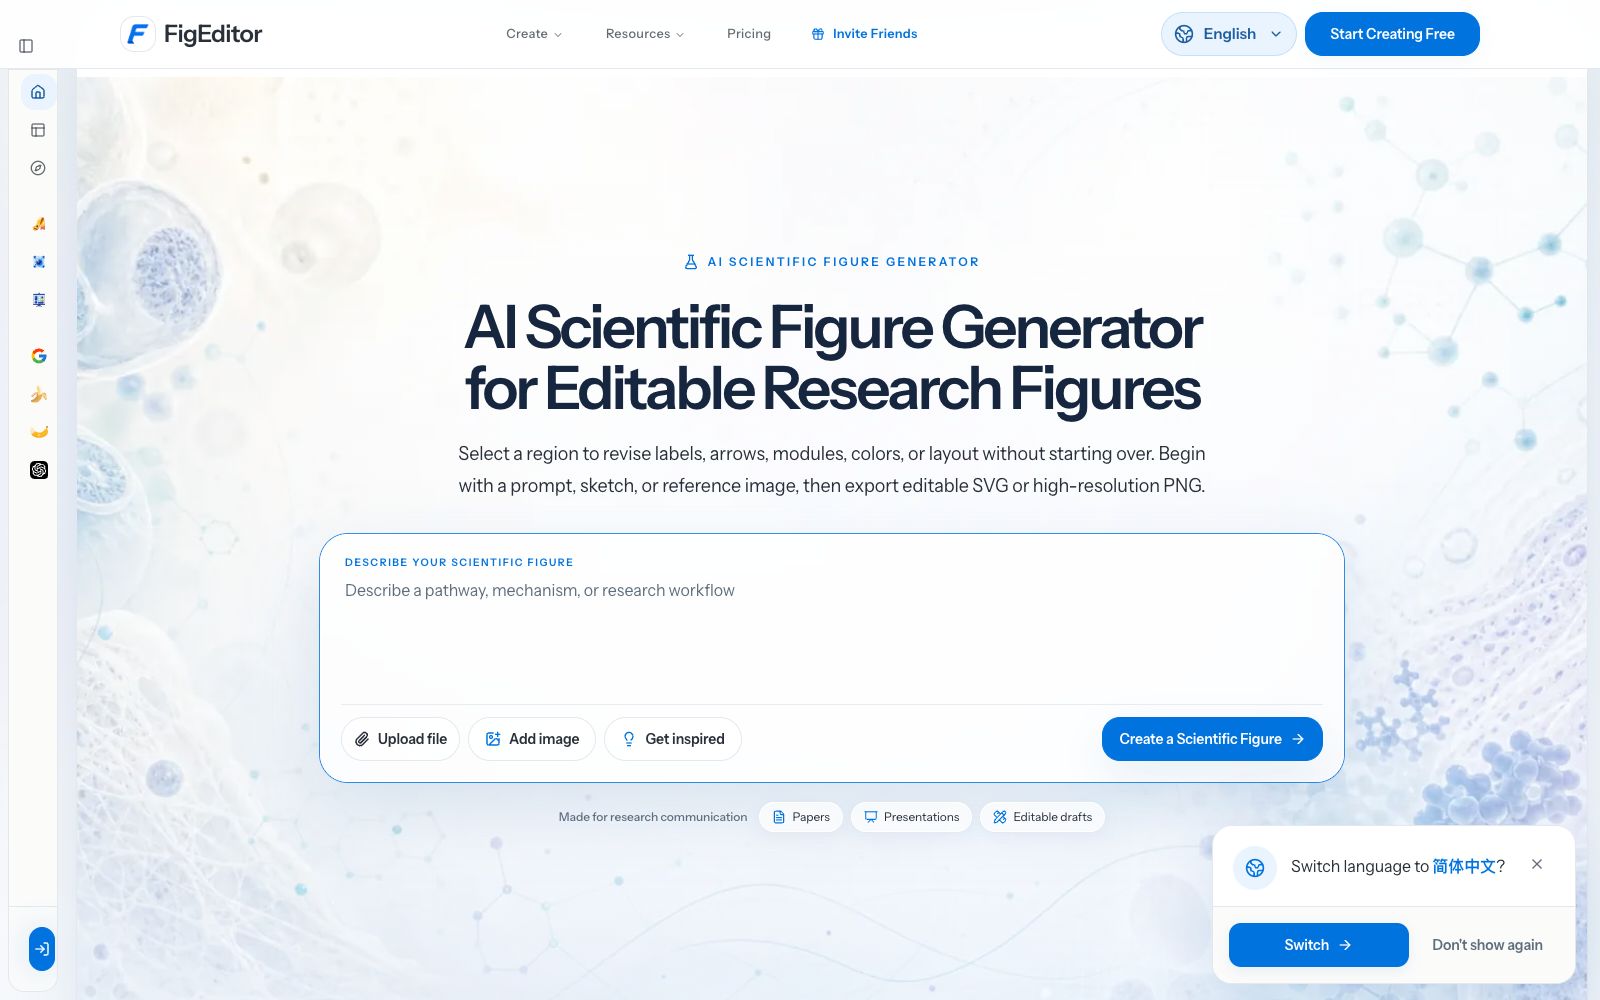
FigEditor is an AI generator for scientific research graphics. It can generate flowcharts, mechanism diagrams and data charts starting from prompt words, sketches or reference images. The official website supports revising labels, arrows, modules, colors and layouts of selected areas, and exports editable vector graphics or high-definition images.
Updated: 2026-10-27
What is FigEditor?
The official website of FigEditor describes itself as an AI generator for editable scientific graphics: users can start from prompts, sketches or reference images to generate scientific graphics, flowcharts and diagrams. The official website emphasizes that users can select local areas to revise labels, arrows, modules, colors or layouts without redrawing; export formats include editable vectors and high-resolution images.
Who is it for?
- Researchers who need to quickly turn mechanism diagrams, flowcharts or abstract diagrams into editable drafts.
- Students and research assistants who frequently create research graphics for papers, group meetings and defenses.
- Small research groups that wish to unify the style of graphics and make repeated fine-tunings before submission.
- Research support personnel who need to generate standardized graphics from sketches or reference images.
- Teaching or research assistants responsible for organizing course handouts, presentation materials, and research posters.
Key features
6Multi-source Input
The official website states that research graphics can be created from prompts, sketches, or reference images, making it suitable to start from ideas, hand-drawn sketches, or existing references.
Local Refinement
The official website states that after selecting a region, you can revise labels, arrows, modules, colors, or layouts without having to redraw from scratch.
Editable Output
The official website states that editable vector files or high-resolution images can be exported, facilitating submission, presentation, and subsequent modifications.
Specialized Toolset
The official website lists tools such as a concept map generator, mind map generator, AI flowchart generator, journal cover maker, heat map, pie chart, bar chart, and column chart.
Image Model Selection
The official website provides access to multiple image model entry points and states that it can generate scientific illustrations, posters, and infographics.
For Scientific Communication
The official website lists applicable scenarios as papers, presentations, and editable drafts, covering the research workflows of institutions and disciplines.
How to use FigEditor
- 1First use a specialized tool that is closest to the target, rather than generating directly with broad prompts, to reduce structural rework at a later stage.
- 2After generation, prioritize revising labels, arrows and module relationships before adjusting colors and layouts to avoid triggering a redraw of the entire graphic due to small changes.
- 3Before delivery, confirm the requirements for image format, resolution and font from the target journal or conference, and then select the export format.
- 4The official website page provides a prompt for switching to Simplified Chinese, and Chinese users should first check if the interface language and terminology translations are in line with usage habits.
- 5When referring to published figures or other people's materials as references, first confirm the boundaries of authorization and citation.
- 6First generate a structural draft and save it, then refine each module step by step; this preserves the available version and prevents subsequent modifications from damaging the confirmed parts.
- 7Name the graphic and record the input sources at the same time to facilitate version retrieval later.
Traffic & popularity
Data month Sep 2026
FigEditor receives about 2.3K visits per month and ranks #8,832,787 worldwide.
Monthly visits
9 monthsTraffic sources
- Direct32.9%
- Search30.0%
- Referrals11.9%
- Display ads7.4%
- Social6.8%
- Other11.0%
Top countries
- United States51.3%
- Brazil32.0%
- India16.8%
Estimated from third-party traffic data.
Similar tools
 SciDraw AISciDraw AI is an AI scientific illustration and data visualization platform for researchers. Officially, it can generate paper-level illustrations from text or sketches, supports plotting with CSV data and editable export in SVG/PPTX formats, and is compatible with the submission specifications of mainstream journals.
 BiorenderA scientific diagram software for scientific research scenarios, featuring an AI diagram generation assistant and an icon library. It allows the creation of data charts, schematic diagrams and slides on the same platform, and the official claims that no design skills are required.