


Biorender
A scientific diagram software for scientific research scenarios, featuring an AI diagram generation assistant and an icon library. It allows the creation of data charts, schematic diagrams and slides on the same platform, and the official claims that no design skills are required.
Updated: 2026-10-26
What is Biorender?
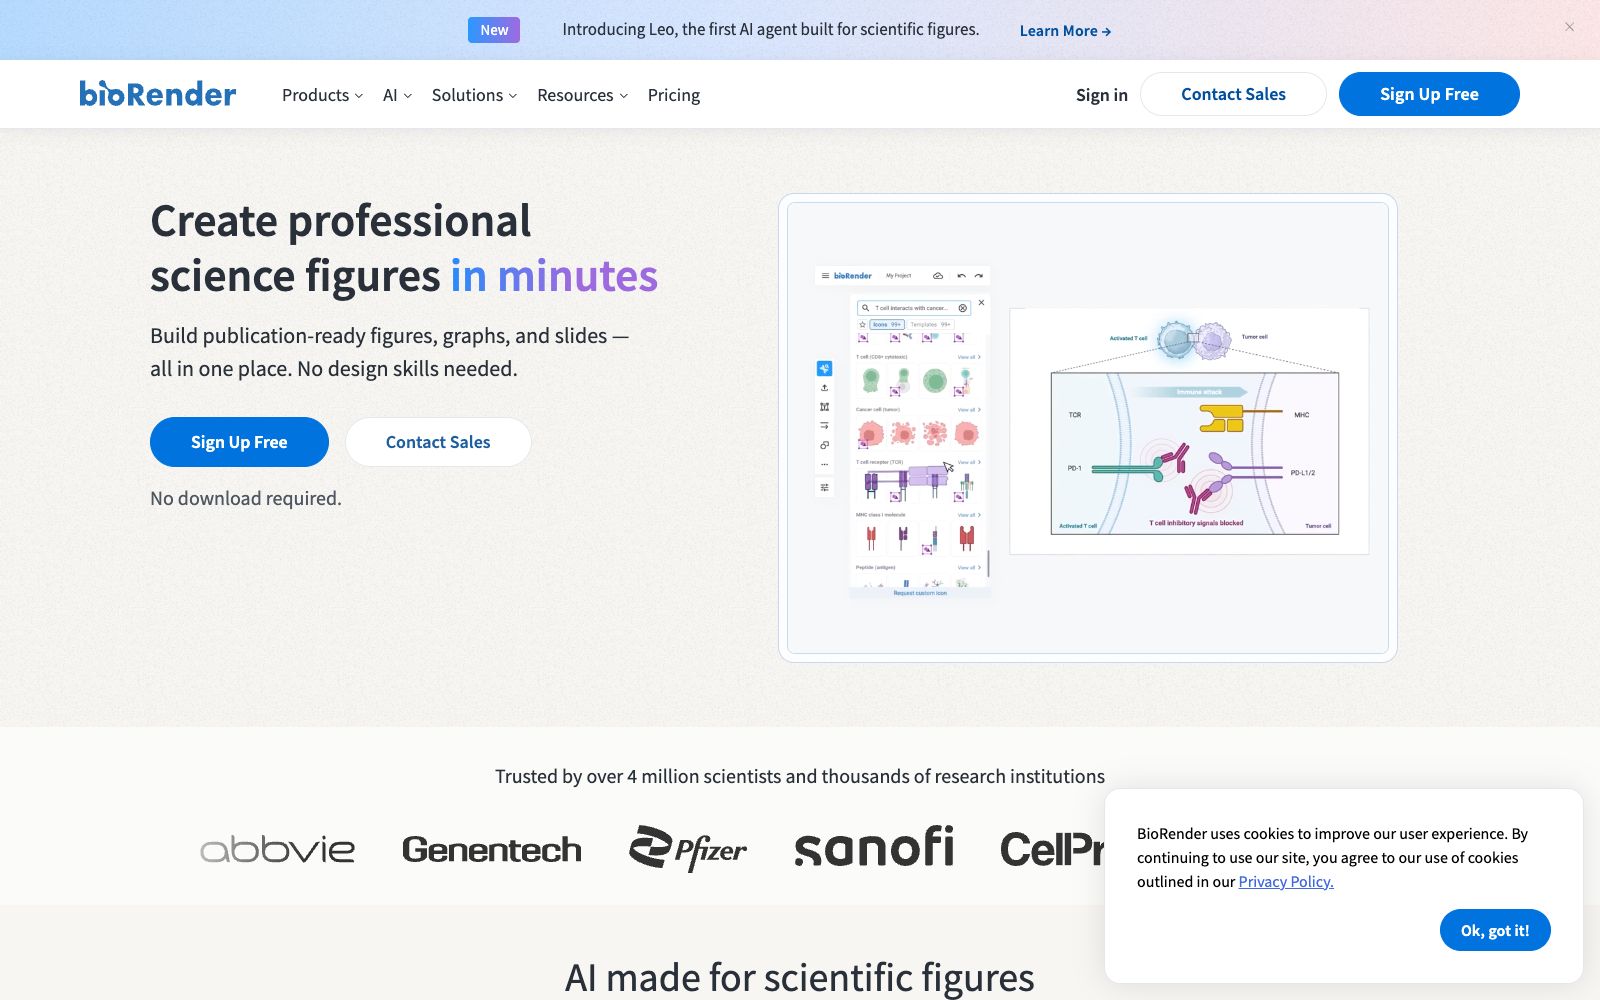
BioRender is a software specifically designed for creating scientific illustrations. The main title on its homepage is "Create professional science figures in minutes", and the subtitle reads "Build publication-ready figures, graphs, and slides — all in one place. No design skills needed." It has turned "how to draw professional schematic diagrams in a thesis" into reusable assets: over 50,000 scientifically accurate icons and templates, a unified visual style, and export options that are directly acceptable for submission. Recently, it has packaged its AI capabilities into Leo, which the official website calls "the first AI agent built for scientific figures". The AI is responsible for layout planning and drafting, but every element remains editable.
Who is it for?
- Graduate students and postdocs writing papers for journal submission: They need to quickly create mechanism diagrams and flowcharts that comply with journal standards.
- Scientific teams at pharmaceutical and biotech companies: The official website mentions "How pharma teams move research forward, faster" and notes that leading pharmaceutical companies all use it.
- Research leaders preparing project applications: They need systematic multi-figure layout and retain space for subsequent modifications.
- Science popularizers who explain complex mechanisms: Visualization with icons is more intuitive than pure text.
Key features
5AI-Editable Diagrams
Described on the official website as "Quickly generate figures you can break apart into editable elements", the results can be split into independent elements such as text, images, lines, and arrows.
Apply BioRender Style
Upload photos, screenshots or reference images and convert them into an editable visual style that matches the entire set.
Fine-tune any element
Precisely modify any icon or graphical element by describing it in words, and the official emphasizes "so your figures match your science".
Analyze / Illustrate / Collaborate / Present
Import raw data from CSV, Excel, or Prism to generate charts, then move on to figure creation, collaborative commenting, and finally slide export.
Icon Library and Templates
50,000+ scientifically accurate icons, along with product lines such as poster generation.
How to use Biorender
- The free version only allows creating 3 figures and 1 Graphing file, and it clearly states "No commercial use or publication" — you must upgrade to a paid plan for submission or commercial use.
- The pricing page structure is Academic / Individual ($35/month, annual payment) / Lab ($99/month, annual payment, 5 seats included) / Institution (custom pricing for 20+ users).
- Graphing and AI diagram generation are chargeable add-ons priced per seat separately.
- First, use the icon library to create a rough draft, then use AI to fill in the complex parts, and finally manually adjust the text and lines.
- The submission format and resolution shall be subject to the guidelines of the target journal.
- What AI generates is "editable", not "automatically correct".
- The scientific expressions in the figures still need to be manually verified.
Traffic & popularity
Data month Sep 2026
Biorender receives about 4.9M visits per month and ranks #8,197 worldwide.
Monthly visits
12 monthsTraffic sources
- Direct57.7%
- Search32.5%
- Referrals4.5%
- Mail2.3%
- AI assistants1.6%
- Other1.5%
Top countries
- United States34.4%
- Australia4.8%
- China4.3%
- Germany4.0%
- Mexico3.8%
Estimated from third-party traffic data.
Similar tools
 SciDraw AISciDraw AI is an AI scientific illustration and data visualization platform for researchers. Officially, it can generate paper-level illustrations from text or sketches, supports plotting with CSV data and editable export in SVG/PPTX formats, and is compatible with the submission specifications of mainstream journals.
 PicDocAI Text Visualization Assistant: One-click conversion of text, papers and manuscripts into scientific research drawings, infographics and PPTs. Officially stated to support SCI journal specifications and 4K high-definition export, suitable for scientific research and educational scenarios.
 BnbIconsAn AI icon generation tool focused on icons, officially described as inspired by the Airbnb style, which can generate customized isometric skeuomorphic icons, suitable for use as interface graphic elements on product official websites, landing pages, and within apps.
 FindinAn AI agent for the entire research process, its official website lists capabilities such as literature review, literature tabulation, scientific research drawing, literature Q&A, note extraction and topic classification. Basic functions are free, and AI capabilities are redeemed with flying beans.
 FigEditorFigEditor is an AI generator for scientific research graphics. It can generate flowcharts, mechanism diagrams and data charts starting from prompt words, sketches or reference images. The official website supports revising labels, arrows, modules, colors and layouts of selected areas, and exports editable vector graphics or high-definition images.
 DGMAn online hand-drawn note and diagramming tool for professionals, based on smart graphics and an infinite canvas. It supports real-time team collaboration and multi-page management, and can generate code with Visual AI. It is built on the open-source canvas library DGM.js.