


Infogram
A data visualization tool under Prezi, it can create interactive charts, maps, infographics and reports, supports embedding and sharing, and its official website states that the entire process from charts to infographics can be assisted by AI.
Updated: 2026-10-26
What is Infogram?
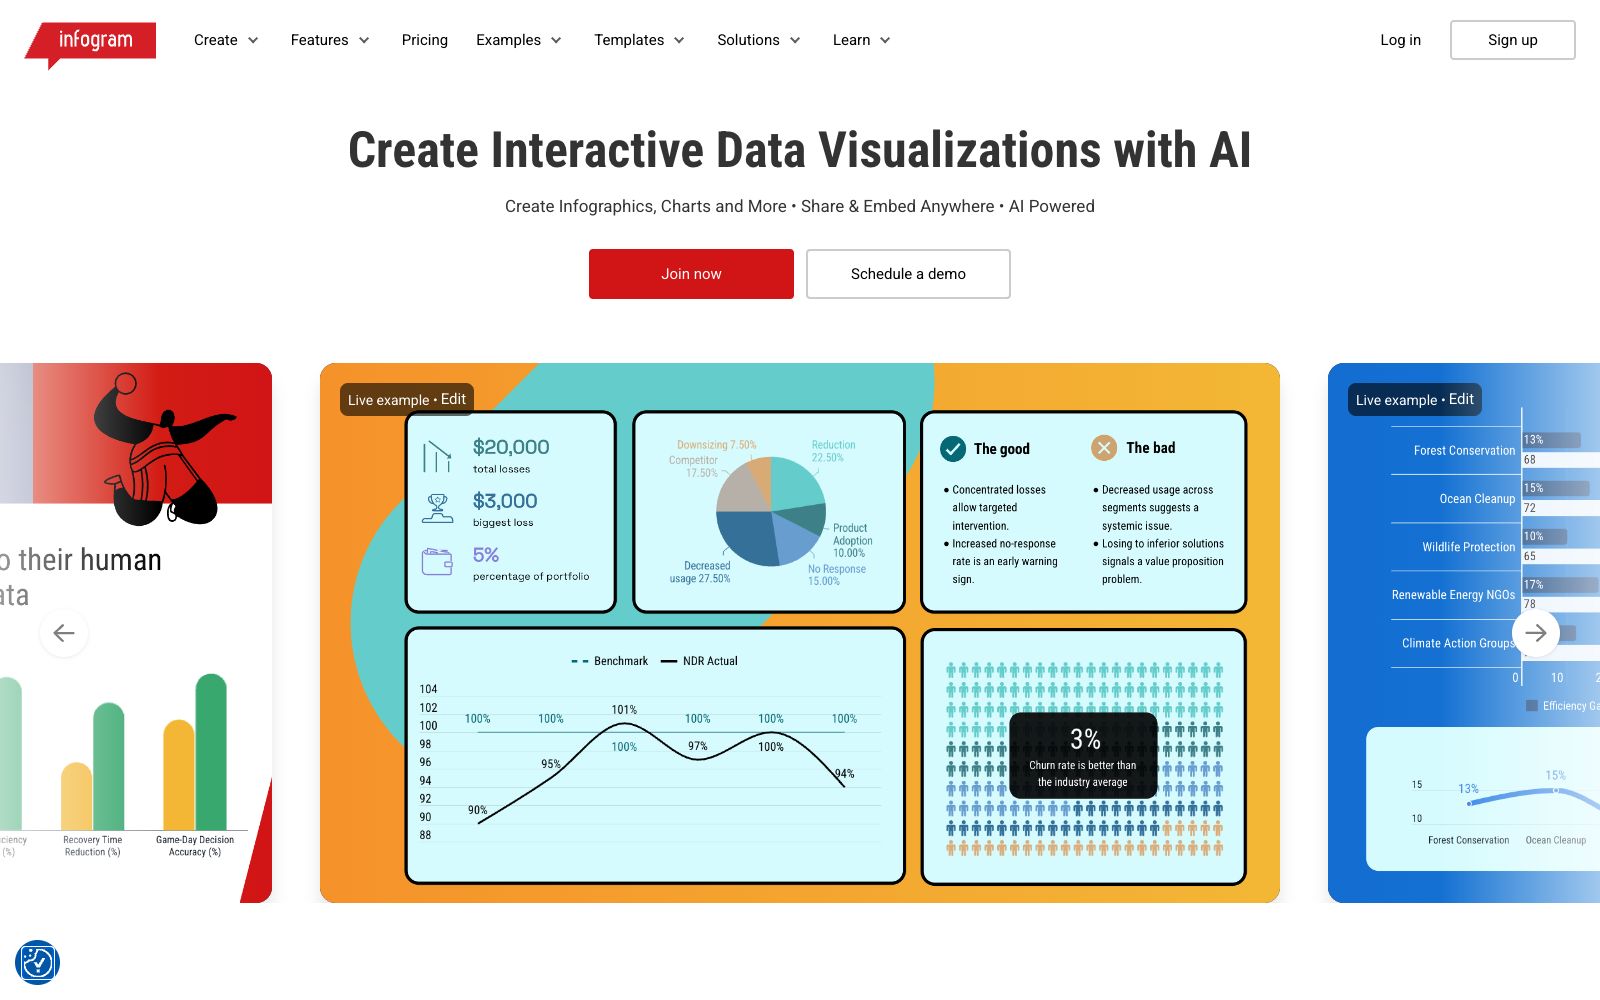
Infogram is a data visualization tool under Prezi. Its official website positioning is "turning data into interactive stories". It can create interactive charts, maps, infographics and reports, and supports sharing and embedding anywhere. Its AI capabilities cover the entire process from charts to infographics. The platform has built-in entrances such as AI infographic maker, AI chart and graph generator, and AI chart recommendations. Compared with design tools that focus on aesthetic layout, Infogram emphasizes data expression and release: it has detailed chart types, maps are its feature, and it provides functions for the release stage such as interaction and animation, embedding, and content engagement analysis. The official website also marks its capabilities in accessibility and compliance.
Who is it for?
- Media and content teams that need to turn data into interactive and embeddable charts
- Organizations that create industry reports, annual reports, white papers and require map visualization
- Marketers and PR professionals who need to quickly create shareable infographics
- Enterprises and public sector organizations with requirements for accessibility and data security compliance
- Developers who need to integrate visualizations into their own systems, as the platform provides an API
- Editors and researchers who create thematic data visualizations for elections, public opinion, and other topics
Key features
7Interactivity and Animation
The official website lists this as one of the key features, which enables charts and infographics to be interactive and have dynamic effects on the page.
Sharing and Embedding
Allows sharing your creations and embedding them anywhere, making them suitable for inclusion in press releases, official website pages, or client reports.
Professional Chart and Map Library
Offers pie charts, line charts, bar charts, column charts, Gantt charts, bubble charts, funnel charts, dual-axis charts, treemaps, word clouds, radial charts, area charts, scatter plots, pyramid charts, etc., and supports custom maps.
AI end-to-end assistance
Includes AI infographic creation, AI chart and graph generator, and AI chart recommendations. The official website states that the entire process from charts to infographics is AI-driven.
Data Import & Auto-Layout
Supports importing data and automatic typesetting, and also provides annotation tools, custom links, and advanced editing tools.
Dashboards and Slides
In addition to infographics and reports, it can also create real-time dashboards for monitoring key metrics, presentation slides, tables, and posters.
Branding & Compliance
Offers brand kits, team templates, royalty-free media libraries, integrations and APIs, and content engagement analytics, and is marked as WCAG 2.2 accessible and SOC 2 Type 2 compliant.
How to use Infogram
- Before making a chart, first determine "what problem to illustrate", then let the AI chart recommendation give advice on the type.
- this is usually more time-saving than choosing the style first.
- For works to be placed on a web page, publish them in an embedded way.
- For subsequent data updates, you only need to modify the source file without redoing the layout.
- For map-based visualizations, it is recommended to first confirm whether the geographic scope of the data matches the regional level supported by the tool.
- For team collaboration, first configure the brand kit and team templates to ensure a unified definitions for external release.
- The official website provides free registration and an appointment for a demo entrance.
- the differences in functions and seats are subject to the instructions on the current page.
- There are also recordings of two introductory and advanced webinars on the site for reference.
- Before external release, pay attention to checking the data sources, citation specifications and material authorizations.
- for personal data, also confirm the compliance requirements.
Traffic & popularity
Data month Sep 2026
Infogram receives about 181.5K visits per month and ranks #281,530 worldwide.
Monthly visits
12 monthsTraffic sources
- Direct49.9%
- Search34.8%
- Referrals8.8%
- Social3.4%
- Mail1.9%
- Other1.2%
Top countries
- United States17.7%
- Brazil7.8%
- Colombia7.1%
- India5.7%
- Mexico4.3%
Estimated from third-party traffic data.
In these collections
Similar tools
 PageOn.AIPageOn.AI is an AI presentation and infographic creation tool. It uses AI agents to help you research, plan and design your target into an interactive visual story. It supports real-time data visualization, geonarrative and vector animation, going beyond static slides.
 PiktochartA veteran infographic and data visualization design platform, its official website states that it serves 34 million users. It offers Pikto AI Studio, which can quickly transform data into infographics, presentations, reports, e-books and videos without any design background.
 AichartAichart is an AI-driven visual content creation platform positioned as a "chart agent" with in-depth editing capabilities. It covers templates such as charts, PPTs, dashboards and long images, suitable for scenarios like reports, assignments and data dissemination.
 VismeA visual content platform integrating presentations, interactive infographics, design and video, with a built-in AI design assistant. Its official website emphasizes that users without any design foundation can also create professional content and branded materials.
 Graph MakerAn AI charting tool that works with natural language: upload a CSV or table and then ask questions directly. The official states that it can generate bar charts, scatter plots, pie charts, histograms, and line charts, and also declares that it does not store data.
 PicDocAI Text Visualization Assistant: One-click conversion of text, papers and manuscripts into scientific research drawings, infographics and PPTs. Officially stated to support SCI journal specifications and 4K high-definition export, suitable for scientific research and educational scenarios.