


Sourcetable
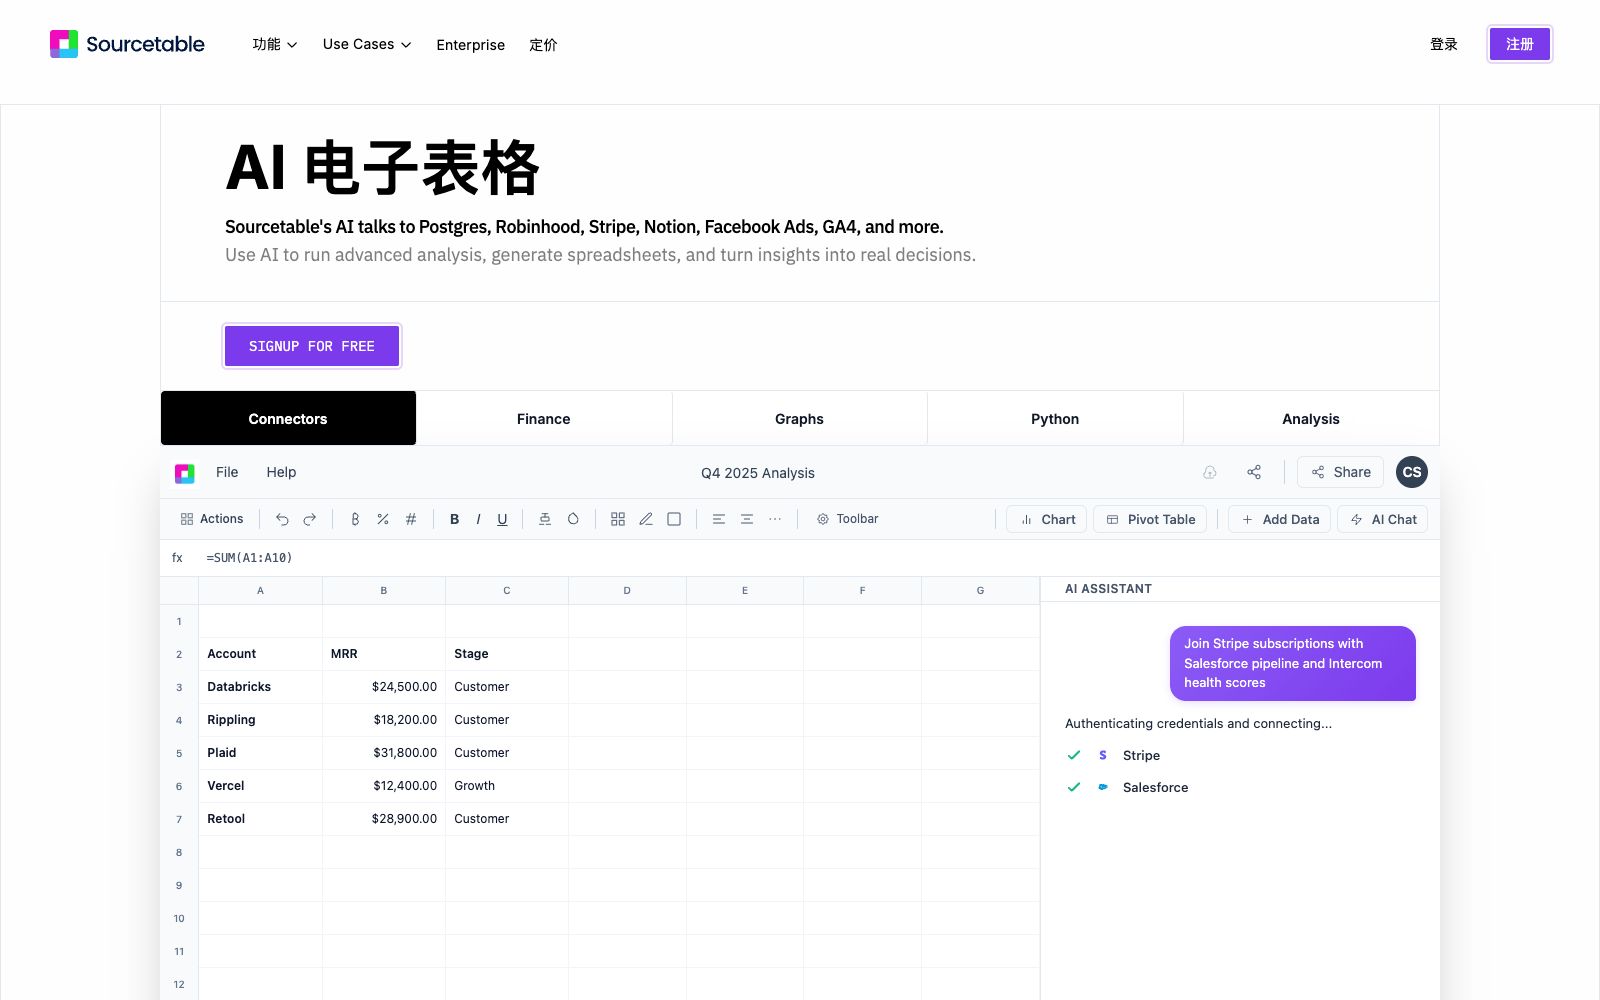
Sourcetable is an AI-native spreadsheet designed for analysts and finance teams. It enables connections to databases and business applications without coding, and allows for querying, modeling, visualization and automated reporting using natural language.
Updated: 2026-10-26
What is Sourcetable?
Sourcetable positions itself as the next-generation spreadsheet, integrating spreadsheets, chat-style AI and Python analytics into one, enabling non-coders to handle data just like data scientists. Targeted at analysts, operations personnel and finance teams, it emphasizes natural language-driven analysis, modeling and decision-making, and claims to be "the last spreadsheet you'll ever need".
Who is it for?
- Analysts and Operations: Teams that want to connect business systems, quickly generate charts and gain insights without writing code, eliminating the hassle of repeatedly exporting and importing spreadsheets.
- Finance teams: Professionals who need to build financial models, analyze market data, and obtain real-time reports for investment decisions are particularly well-suited for subscription and revenue breakdown analysis.
- Data Scientists: For those who work with complex data structures and perform statistical analysis, it can serve as a lightweight collaboration entry point.
- Business and Marketing: Professionals who transform metrics into actionable insights, analyze campaign performance and customer behavior, enabling faster data-driven decision-making.
- Education and Scientific Research: For users who grade assignments, analyze experimental data and discover patterns, it can generate visualizations and charts to assist in explanations.
Key features
5Connect to data sources
Built-in connectors for Postgres, Stripe, Notion, GA4, Supabase, BigQuery, MySQL and more. You can directly query databases and various business applications with AI, enabling everyone on the team to become a data scientist.
Natural Language Analysis
Generate charts instantly by asking questions in English, use Python for custom logic processing, and gain deeper insights with built-in research tools without memorizing function syntax.
Data manipulation and visualization: Clean, reshape and build data using AI, formulas or code, get a usable dataset from raw input in seconds, and display charts and trends automatically or based on conditions.
Data Science Integration
Combines AI intelligence with all of Python's analytical capabilities, enabling data cleaning, querying, modeling, and visualization without switching tools or writing code, and centralizing complex analytics in one place.
Comprehensive auxiliary functions: It can fix formulas, write SQL, summarize insights, analyze large CSVs, build dashboards, automate reports, crawl web pages and create workflows, covering all scenarios of daily data processing.
How to use Sourcetable
- 1First use connectors to access existing data sources, unify tables scattered across various systems in one place before starting analysis, and avoid manual merging.
- 2Describe your problem in English instead of writing formulas, let the AI generate charts and Python logic, then fine-tune manually to lower the entry barrier.
- 3Set up recurring reports as scheduled tasks, letting the AI automatically pull data, generate charts and push them out, reducing manual data handling and version confusion.
- 4For sensitive data, prioritize on-premises or cloud-based solutions. The official website states that it complies with SOC 2 Type 2, HIPAA, and PCI compliance standards.
- 5First, sign up for free to experience AI Chat, then start with specific use cases, such as quarterly revenue breakdown or subscription data reconciliation, and gradually expand to the entire team.
Traffic & popularity
Data month Sep 2026
Sourcetable receives about 108.1K visits per month and ranks #284,793 worldwide.
Monthly visits
12 monthsTraffic sources
- Search83.8%
- Direct11.2%
- Social3.0%
- Referrals1.8%
- AI assistants0.2%
Top countries
- United States28.9%
- Vietnam10.5%
- India7.1%
- Russia5.1%
- Brazil4.6%
Estimated from third-party traffic data.
Similar tools
 Julius AIAn AI workspace for knowledge workers that connects to databases, analyzes data, and generates reports, presentations, charts, and multimodal content in natural language. It supports data sources such as Postgres and Snowflake and has obtained SOC 2 certification.
 SlidebeanSlidebean is an AI fundraising presentation and financial modeling platform for founders. It provides AI pitch deck generation, collaborative design and analysis, as well as design agents and fundraising services.
 QuadraticQuadratic is a workbench that embeds AI into spreadsheets. It connects to data sources such as CSV and databases, generates formulas, code and charts in natural language, and delivers reusable insights.
 Rows AIRows, a spreadsheet with built-in AI analysis capabilities, features the slogan "A cell is a prompt" on its official website: After typing an equal sign, describe your needs to generate formulas, charts and insights without requiring code, formulas or menu operations.
 RowSpeakRowSpeak is an AI data analysis platform for sources such as Excel, CSV, and PDF. It can analyze tables, clean data, generate charts and interactive dashboards with natural language, and support converting images/PDFs to Excel.
 ZettaZetta is an AI data analysis platform for business teams. Officially, it offers conversational AI data analysts, automated insights, visual dashboards and data warehouses, enabling businesses to gain clear insights into data without the need for a dedicated data team.