


Piktochart
A veteran infographic and data visualization design platform, its official website states that it serves 34 million users. It offers Pikto AI Studio, which can quickly transform data into infographics, presentations, reports, e-books and videos without any design background.
Updated: 2026-10-26
What is Piktochart?
Piktochart is a veteran infographic tool. Its official website shows that it has over 34 million users worldwide and a total of 220 million visual works created cumulatively. Its current focus is Pikto AI Studio, a creation suite that streamlines content production. The official website states that it can quickly turn data into infographics, presentations, reports, e-books and videos, also emphasizing that no design experience is required. Its difference from pure presentation tools lies in data expression: the platform emphasizes "transforming complex ideas into visuals that explain problems" and provides a separate entry for AI presentation creation to quickly produce complete sets of slides. The official website also has a dedicated section outlining the path to creating video content without a production budget.
Who is it for?
- Marketers, operations and data analysts who need to clarify complex data
- Professionals who frequently give presentations, conduct training, create course materials, and need to quickly produce complete slide sets
- Content teams that create reports, e-books and long-form visual content
- Small teams that want to create video-based content but have no budget for shooting and editing
- Organizations with brand specification requirements and those that want multiple people to share a single set of templates
Key features
7AI Infographic Generation
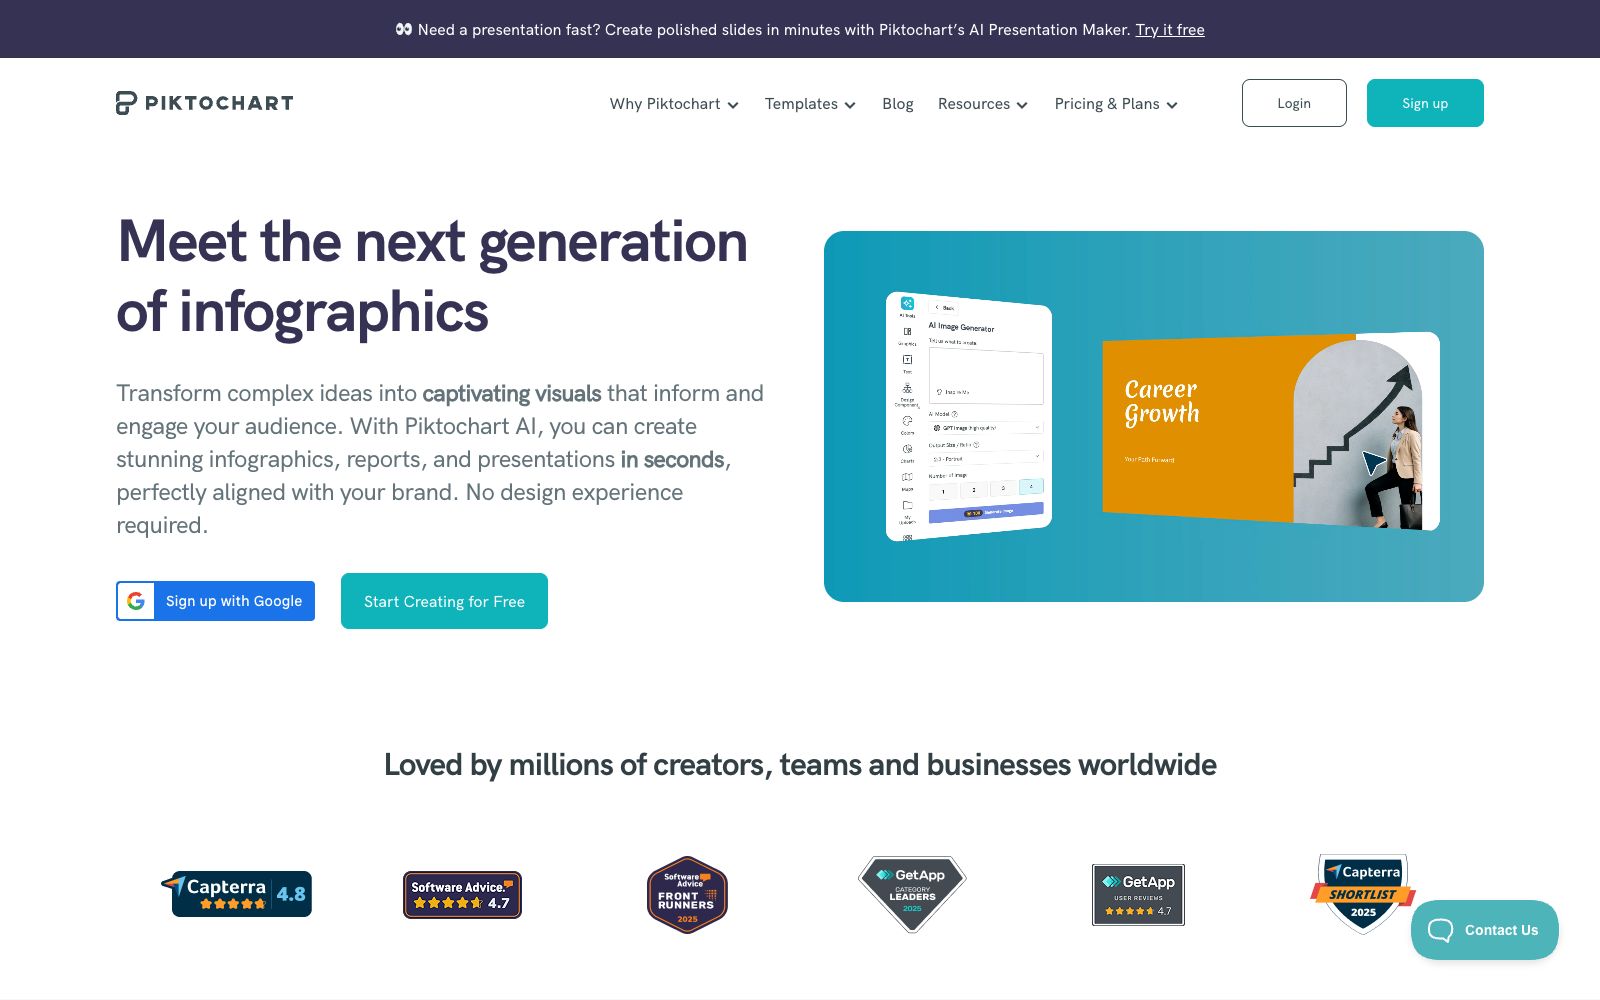
The main screen features the theme "Next-Generation Infographics". According to the official website, it can generate infographics, reports and presentations in seconds while maintaining brand consistency.
AI Presentation Creation
An AI Presentation Maker portal is available on the platform, and according to the official website, complete slide decks can be created in just a few minutes.
Pikto AI Studio
Positioned as an all-in-one visual creation suite, the official website states that the entire creative process is powered by Pikto AI, and it features an entry point for a collection of AI tools.
AI Image Modifier
The official website lists AI image modification capabilities in the feature list, which are used to make AI adjustments to images.
Multi-format Output
The types of creatable content listed on the official website include designs, presentations, reports, e-books and videos, as well as template categories such as infographics, posters and social media images.
Branding & Collaboration
Supports collaboration within a single workspace, and according to the official website, can produce designs that comply with brand guidelines at any time as needed.
Community & Case Studies
It showcases community user works on the platform and compiles user reviews from various professions such as psychology, instructional design, entrepreneurship, and small and medium-sized enterprises.
How to use Piktochart
- If the content is data-related, it is recommended to first organize the conclusions and key figures into a checklist before handing it over to AI to generate the infographic layout.
- This usually makes it easier to get a usable structure than directly pasting a long paragraph.
- When making presentation slides for reports, you can first get a framework from AI Presentation Maker, and then replace the real data page by page.
- The official website provides a free registration portal.
- For official use, it is recommended to first confirm whether the required export formats, collaboration seats and brand features are included in the current package.
- The specific rights and interests shall be subject to the instructions on the official website page.
- There are many templates and materials.
- For team use, it is recommended to agree on a set of templates first to avoid multiple styles in the same report.
- There are a lot of finished products in the community for reference.
- If you are not sure about the expression form, you can first look for ideas according to the pictures.
- For the data, pictures and fonts released to the public, pay attention to verifying the sources and authorizations.
Traffic & popularity
Data month Sep 2026
Piktochart receives about 2.3M visits per month and ranks #19,886 worldwide.
Monthly visits
12 monthsTraffic sources
- Search62.6%
- Direct28.0%
- Referrals4.6%
- AI assistants1.7%
- Social1.6%
- Other1.5%
Top countries
- United States17.4%
- India10.1%
- Mexico6.0%
- Colombia5.5%
- Spain4.9%
Estimated from third-party traffic data.
In these collections
Similar tools
 VismeA visual content platform integrating presentations, interactive infographics, design and video, with a built-in AI design assistant. Its official website emphasizes that users without any design foundation can also create professional content and branded materials.
 InfogramA data visualization tool under Prezi, it can create interactive charts, maps, infographics and reports, supports embedding and sharing, and its official website states that the entire process from charts to infographics can be assisted by AI.
 AlaiAlai is an AI presentation tool focused on brand consistency. It first builds a design system using brand assets, then batch-generates slides, social media graphics and infographics, and supports conversational modifications. It is suitable for marketing and sales teams to quickly produce drafts.
 SlideSpeakAn AI presentation tool that turns PDFs, Word documents, Excel spreadsheets, or a single theme into editable slides, exports native PPT files, and fully retains fonts and layouts.
 PicDocAI Text Visualization Assistant: One-click conversion of text, papers and manuscripts into scientific research drawings, infographics and PPTs. Officially stated to support SCI journal specifications and 4K high-definition export, suitable for scientific research and educational scenarios.
 PageOn.AIPageOn.AI is an AI presentation and infographic creation tool. It uses AI agents to help you research, plan and design your target into an interactive visual story. It supports real-time data visualization, geonarrative and vector animation, going beyond static slides.