


Better Analyst
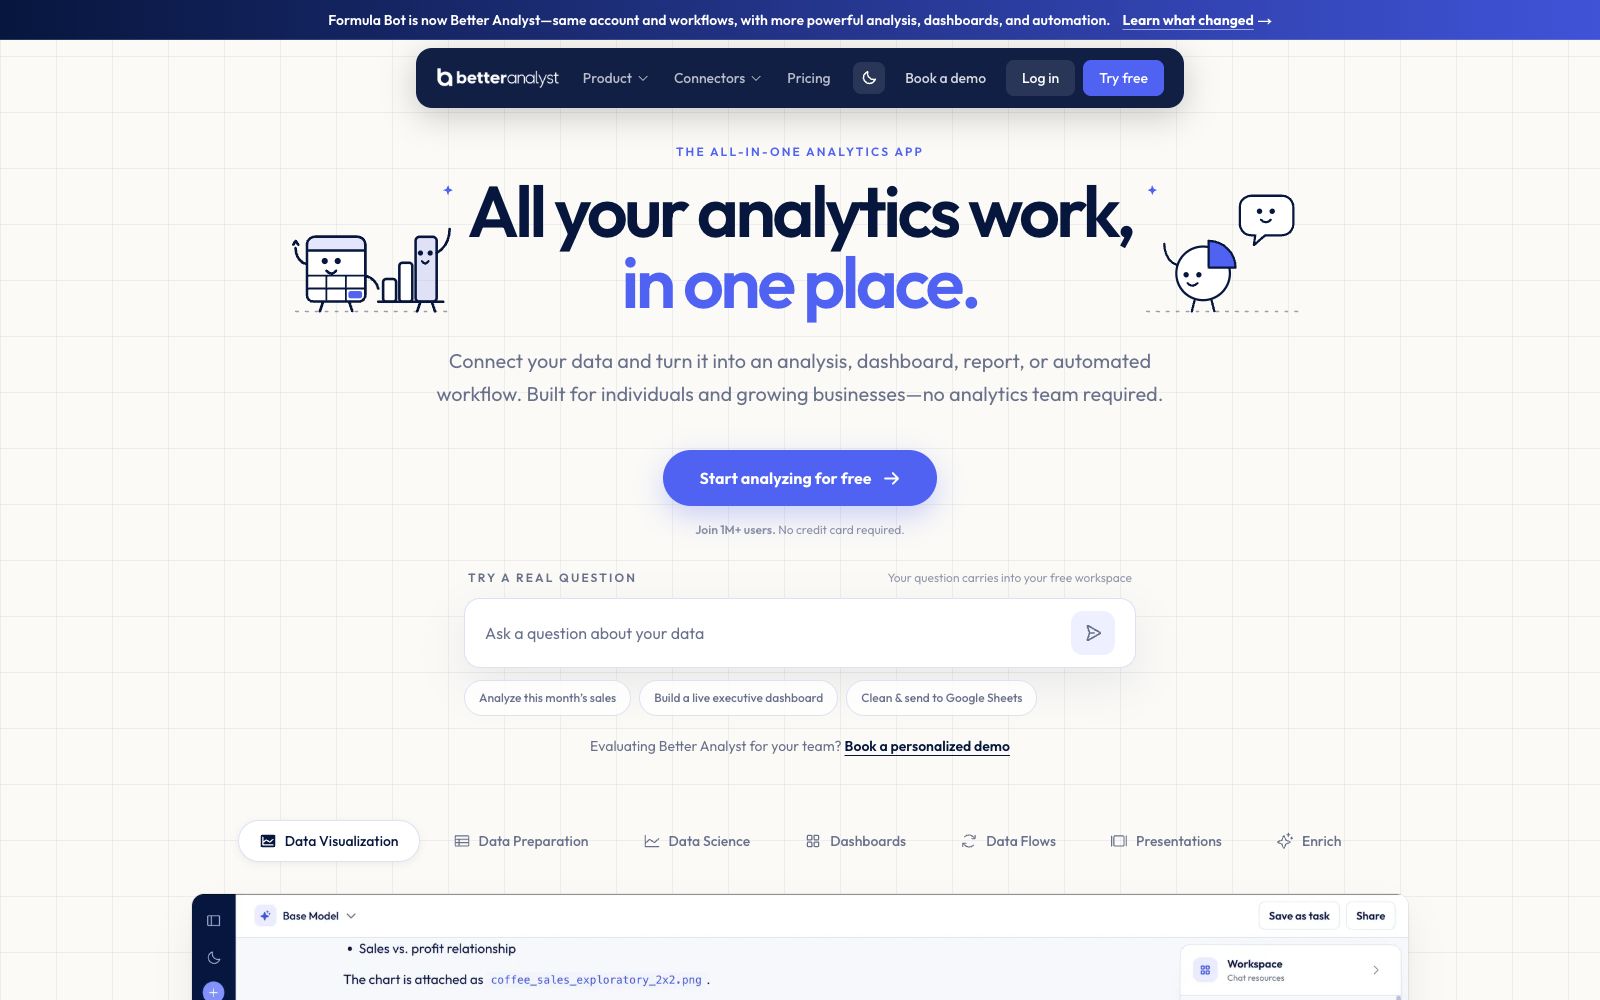
Better Analyst (formerly Formula Bot) is an all-in-one data analysis application that can connect to data sources and generate analyses, dashboards, reports, and automated workflows. It is designed for individuals and growing businesses without a dedicated analytics team.
Updated: 2026-10-26
What is Better Analyst?
Better Analyst (formerly Formula Bot) is an all-in-one data analysis application. Its core is to centralize the entire process from connecting data to generating insights in a single workspace: after users access data sources, they can generate analyses, dashboards, reports or automated workflows, which is suitable for individuals and growing enterprises without a dedicated analysis team. It aims to replace the previously scattered data preparation, analysis and reporting processes with a single set of tools.
Who is it for?
- Individuals and growing businesses with analytics needs but without a dedicated data team, who want to replace manual work with tools.
- Teams tired of moving data between multiple fragmented tools and wanting a unified workflow to improve collaboration efficiency.
- Operations and management personnel who need to generate reports periodically and wish to automate the process to reduce repetitive work and oversights.
Key features
4Integrated Analytics Workspace
After connecting data sources, convert them into analyses, dashboards, reports or automated workflows using natural language, reducing the cost of switching between multiple tools, with all outputs kept in the same context.
Comprehensive analytics capability stack
Covers multiple aspects such as data visualization, data preparation, data science, dashboards, data flow, presentations and data enrichment, basically covering the entire analytics process without the need to integrate multiple software.
Scalable User Base
It has amassed over 1 million users, with its product maturity and stability verified across numerous scenarios, making it suitable for long-term reliance. The iteration of new features is also supported by community feedback.
Low Threshold
You can complete the closed loop from data connection to reporting without an analysis team, and business personnel can also conduct self-service analysis, reducing reliance on experts and communication costs.
How to use Better Analyst
- First connect your data source, then ask questions in natural language, for example, "Analyze this month's sales and create an executive-level dashboard", let AI provide a first draft, and then refine the dimensions.
- Configure repetitive reports into automated workflows, formalize them into periodic tasks, reduce manual operations and omissions, and free up manpower for interpretation.
- Before presenting externally, confirm the logic of the automatically generated charts to ensure that the indicator definitions are consistent with the business and avoid deviations in external presentation logic.
- If you currently compile weekly reports manually using Excel and PPT, you can connect the data source to let the system directly generate updatable dashboards, and then just conduct manual interpretation.
- The key is to first clarify the metric definitions in the questions, such as "split by region and channel, exclude internal test orders", so that the generated dashboards are close to real business scenarios.
- For fixed actions like monthly reviews, after being solidified, they can basically be refreshed with one click, saving the trouble of repeated setup every time.
Traffic & popularity
Data month Sep 2026
Better Analyst receives about 303.1K visits per month and ranks #117,101 worldwide.
Monthly visits
5 monthsTraffic sources
- Search52.1%
- Direct30.9%
- Referrals13.4%
- Social1.4%
- AI assistants1.2%
- Other1.0%
Top countries
- India24.7%
- United States19.7%
- Indonesia8.7%
- Bangladesh4.4%
- Russia4.3%
Estimated from third-party traffic data.
Similar tools
 Julius AIAn AI workspace for knowledge workers that connects to databases, analyzes data, and generates reports, presentations, charts, and multimodal content in natural language. It supports data sources such as Postgres and Snowflake and has obtained SOC 2 certification.
 Tableau GPTA business intelligence and data analysis platform under Salesforce, it can connect to almost all databases and generate visualizations through drag-and-drop, and has integrated Agentic AI and conversational analysis (Tableau Agent) into its entire product line.
 ZettaZetta is an AI data analysis platform for business teams. Officially, it offers conversational AI data analysts, automated insights, visual dashboards and data warehouses, enabling businesses to gain clear insights into data without the need for a dedicated data team.
 BricksAn AI analysis tool for tabular data. You can upload files or connect to data sources to generate interactive dashboards. It supports one-click refresh, template reuse and various chart types, making it suitable for business personnel to create weekly and monthly reports.
 ThoughtSpotThoughtSpot is an intelligent agent analytics platform that provides AI analysts, intelligent semantic modeling, dashboard generation and automated insights, and can embed analytics capabilities into other work interfaces such as Slack and Claude.
 RowSpeakRowSpeak is an AI data analysis platform for sources such as Excel, CSV, and PDF. It can analyze tables, clean data, generate charts and interactive dashboards with natural language, and support converting images/PDFs to Excel.