


PicDoc
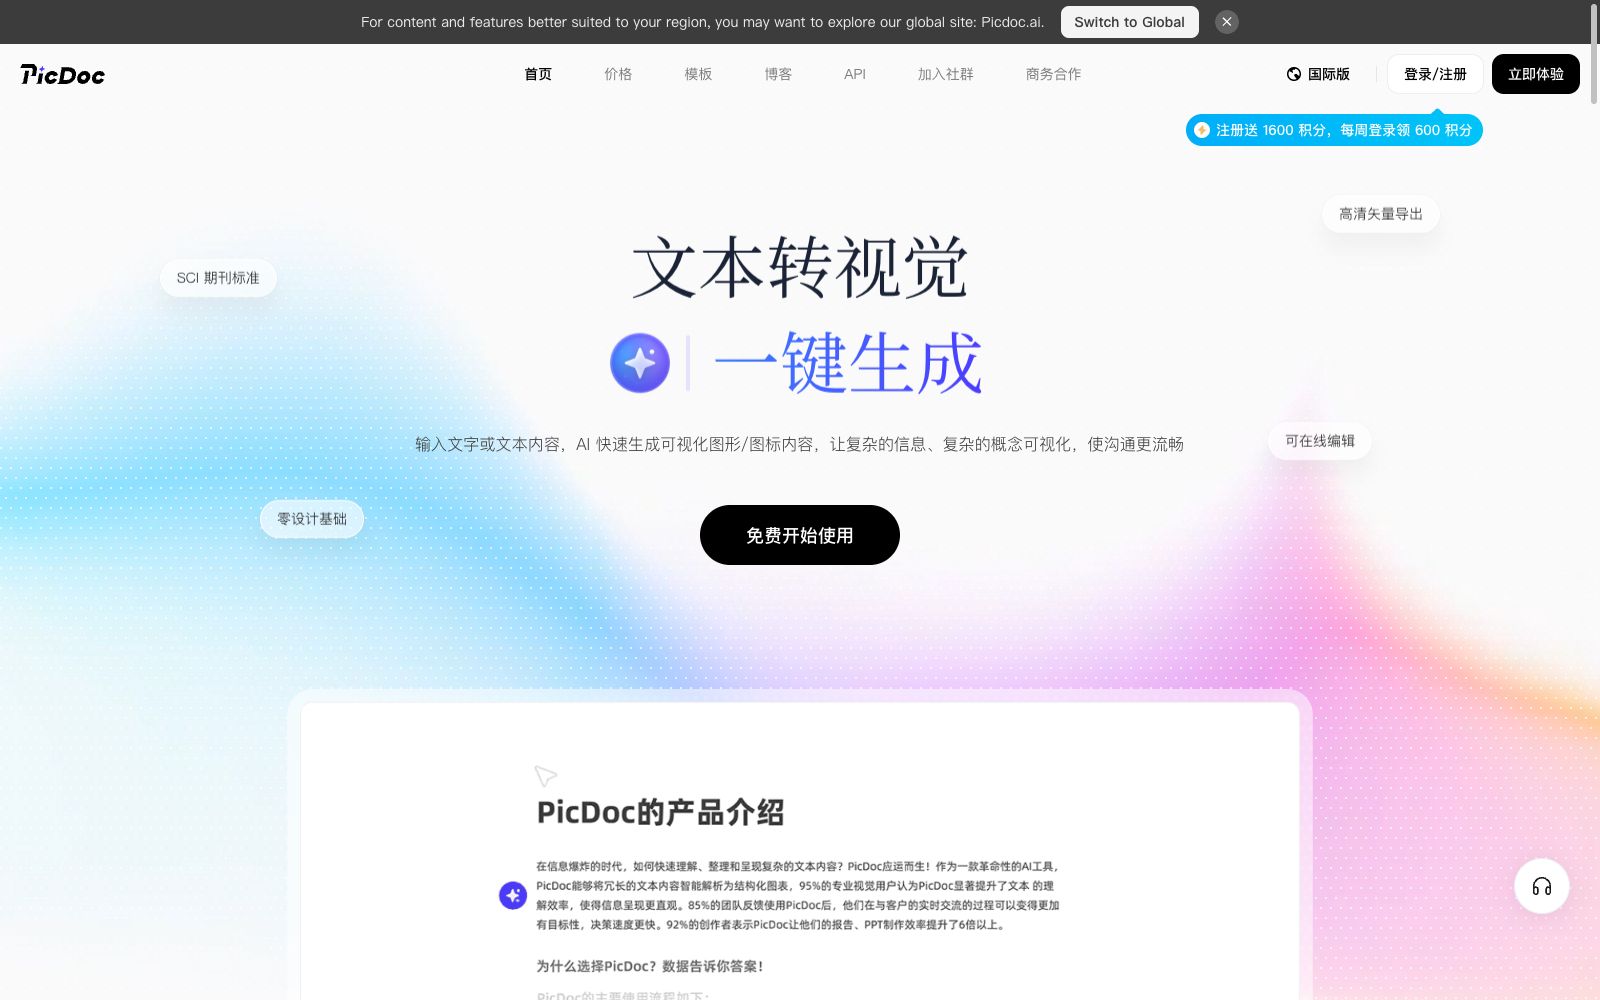
AI Text Visualization Assistant: One-click conversion of text, papers and manuscripts into scientific research drawings, infographics and PPTs. Officially stated to support SCI journal specifications and 4K high-definition export, suitable for scientific research and educational scenarios.
Updated: 2026-10-26
What is PicDoc?
PicDoc is an AI text visualization assistant for scientific research and education. Its official website states that it enables everyone to quickly transform ideas, research and knowledge into clear and understandable visual graphics, covering scientific research mechanism diagrams, experimental flowcharts, technical roadmaps, academic illustrations and PPTs. It emphasizes "understanding" the content first and then "drawing" it, rather than mechanically applying templates.
Who is it for?
- College graduate students and researchers who write papers, prepare project proposals and defense PPTs, as visual materials are a frequent, essential and time-consuming need.
- Disciplinary researchers in medicine, biology, chemistry, etc., who need to visualize experimental data and research frameworks into schematic diagrams, with standardized diagram production required.
- Content creators who do science popularization, Xiaohongshu graphic content and knowledge cards can quickly produce clear and easy-to-understand diagrams.
- Teachers and office workers who want to quickly create professional illustrations without any design background, reducing the threshold for drawing and outsourcing costs.
- Students who need to visualize defense and proposal materials can generate PPTs and framework diagrams in one place for a more hassle-free experience.
Key features
6Text Analysis and Integration
Upload files or paste text; the AI automatically extracts core viewpoints, methods, innovations, and conclusions, and supports traceable auxiliary writing and knowledge base construction.
One-click generation of scientific research illustrations
One-click generation of mechanism diagrams, technical routes, and data charts based on content logic. The official claims that they meet the standards and academic aesthetics of SCI journals, eliminating hand-drawn work.
Online Editing with Layered Text and Graphics
All graphics support separation of text and graphics, online editing without the need for redrawing, simple operation, retaining the layout while modifying text, and suitable for repeated refinement.
High-definition export in multiple formats
Supports export in PDF, PNG, PPT and other formats. The official states that the resolution can reach 4K, meeting the requirements for journal publication and thesis printing.
Rich Templates
Built-in various types of scientific and infographics such as mechanism diagrams, signal pathway diagrams, experimental flowcharts, Venn diagrams, and radar charts, covering multiple disciplines.
Low Threshold
The official website emphasizes that you can create professional diagrams with "zero design experience", allowing researchers to focus on their research itself rather than drawing skills.
How to use PicDoc
- First, paste a section of the paper abstract or upload a Word/PDF file, experience the minimal closed loop of "generate → edit → export", confirm the style and then process in batches.
- Before submitting scientific figures for formal publication, be sure to check the data, annotations and journal format requirements for each figure one by one.
- AI-generated content should only be used as a draft and should not be submitted directly.
- When using real experimental data and image materials, confirm the copyright and attribution, and comply with relevant regulations and authorization scope for commercial use or publication.
- The data such as "efficiency improvement" claimed on the official website is for official reference only.
- the actual effect shall be subject to your own usage.
- functions and packages may be adjusted.
Traffic & popularity
Data month Sep 2026
PicDoc receives about 13.3K visits per month and ranks #1,879,392 worldwide.
Monthly visits
12 monthsTraffic sources
- Direct49.3%
- Search35.3%
- Referrals10.2%
- Social4.1%
- AI assistants1.1%
Top countries
- China91.7%
- Taiwan, China3.4%
- United States3.1%
- Hong Kong, China1.1%
- Malaysia0.8%
Estimated from third-party traffic data.
Similar tools
 SciDraw AISciDraw AI is an AI scientific illustration and data visualization platform for researchers. Officially, it can generate paper-level illustrations from text or sketches, supports plotting with CSV data and editable export in SVG/PPTX formats, and is compatible with the submission specifications of mainstream journals.
 FindinAn AI agent for the entire research process, its official website lists capabilities such as literature review, literature tabulation, scientific research drawing, literature Q&A, note extraction and topic classification. Basic functions are free, and AI capabilities are redeemed with flying beans.
 BiorenderA scientific diagram software for scientific research scenarios, featuring an AI diagram generation assistant and an icon library. It allows the creation of data charts, schematic diagrams and slides on the same platform, and the official claims that no design skills are required.
 PiktochartA veteran infographic and data visualization design platform, its official website states that it serves 34 million users. It offers Pikto AI Studio, which can quickly transform data into infographics, presentations, reports, e-books and videos without any design background.
 AIWork365An AI writing and creation tool for domestic office scenarios, which the official says covers writing for all industries and scenarios, and provides modules such as PPT generation, AI drawing, and bid and thesis assistants.
 InfogramA data visualization tool under Prezi, it can create interactive charts, maps, infographics and reports, supports embedding and sharing, and its official website states that the entire process from charts to infographics can be assisted by AI.