


Bricks
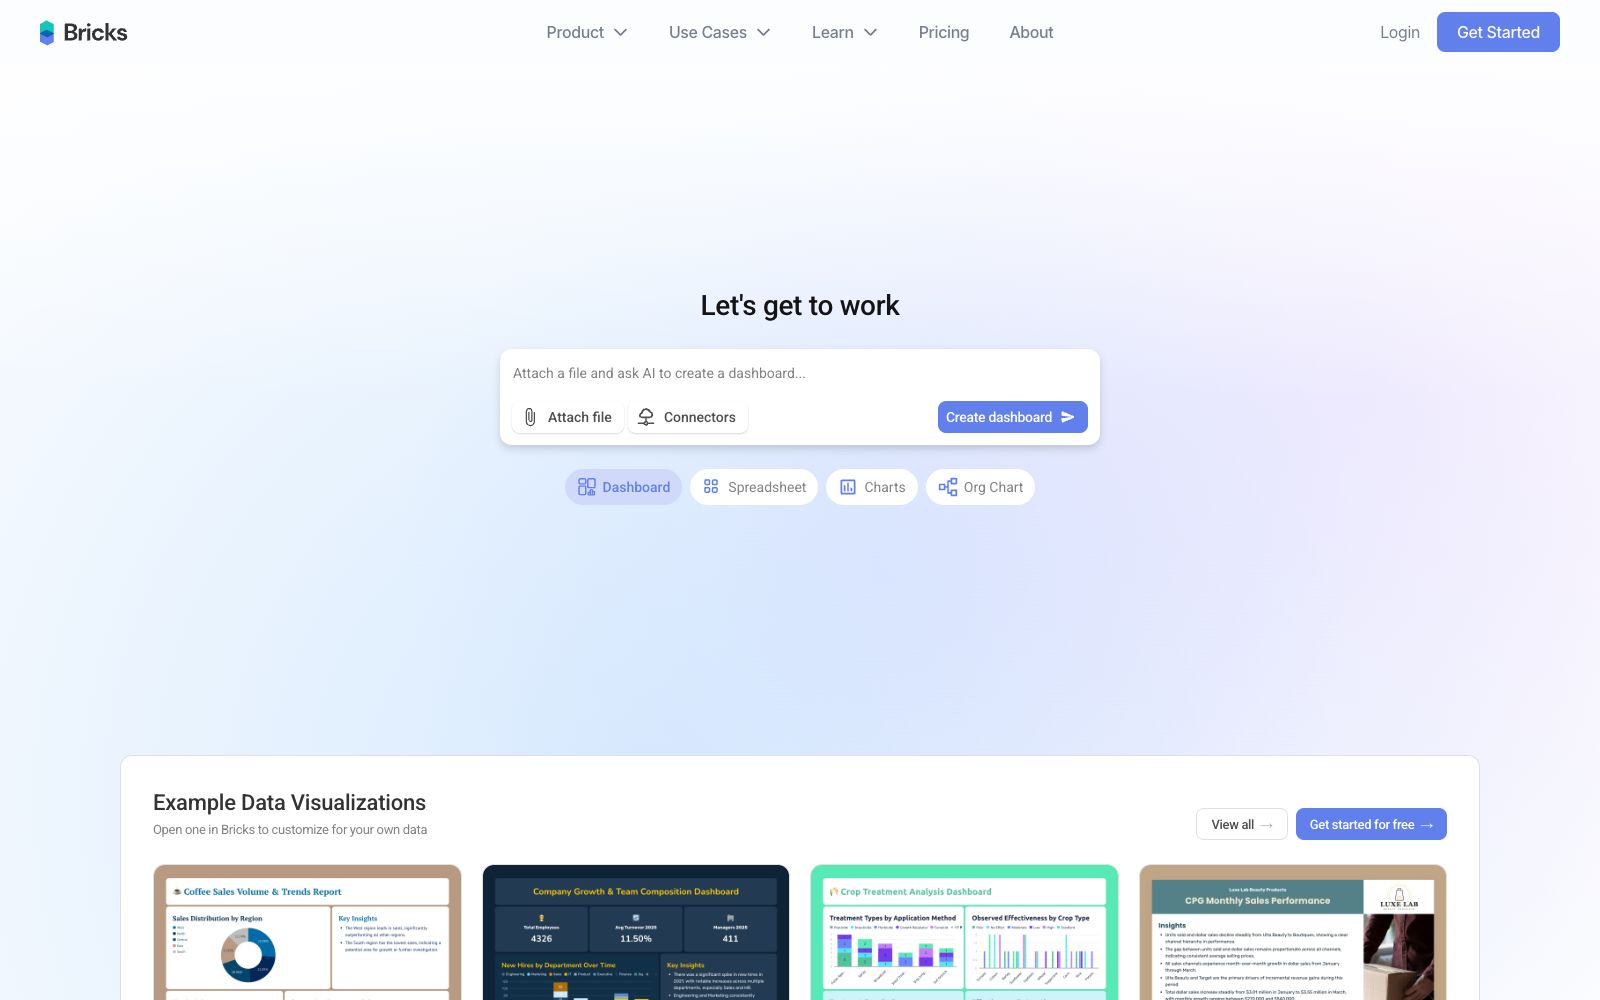
An AI analysis tool for tabular data. You can upload files or connect to data sources to generate interactive dashboards. It supports one-click refresh, template reuse and various chart types, making it suitable for business personnel to create weekly and monthly reports.
Updated: 2026-10-26
What is Bricks?
Bricks is an AI analysis and visualization tool for tabular data. Just drag and drop CSV or Excel files, and you can generate interactive dashboards and reports within seconds. The team positions it between manual Excel chart creation and heavy-duty BI tools like Tableau: it is more convenient than the former and lighter than the latter. According to the official statement, more than 100,000 professionals already use it to create reports.
Who is it for?
- Operations and finance personnel who need to release weekly and monthly business reports every week.
- Small and medium-sized teams that do not have dedicated data analysts but still need dashboards for management.
- Business professionals who are frustrated with creating charts in Excel and don't want to spend time learning Tableau.
- External service providers such as consulting and operation outsourcing companies who need to quickly deliver reports to clients.
- Students and researchers use it to organize questionnaire or experimental data.
- Marketing and sales teams that need to adapt the same data into versions for different audiences.
- Agency companies and freelancers who create monthly client reports, with deliverables that need to be visually appealing and editable.
Key features
7Generate a dashboard in one sentence
After uploading a file or connecting to a data source, the AI directly produces charts, metric cards and full-page layouts, eliminating the step of inserting images one by one.
Element-level Editing
Drag and drop to adjust the layout, and you can also modify charts using natural language. Each chart and each block of text can be fine-tuned individually.
One-click Refresh
After replacing the data, all charts are regenerated while the original layout is retained, eliminating the need for rearranging from scratch.
Interactive Filtering
Click on any data point to filter the entire dashboard in a linked manner, which is used to trace anomalies or drill down for detailed analysis.
Template Reuse
Save your preferred layouts as templates and apply them directly with new data next time, ideal for periodic reports.
Comprehensive chart types
It includes common visualizations such as column and line charts, scatter plots, funnel charts, Sankey diagrams, heat maps, treemaps, and geographic maps.
Multi-source Integration
In addition to local files, you can also import data from Google Sheets or databases, and export dashboards to slides.
How to use Bricks
- 1First, run a test with a well-structured table; standardized field names can significantly improve the generation quality.
- 2Don't send it right after generation; check the metrics and totals one by one. The AI's layout is correct, but the numbers still need to be reviewed by humans.
- 3For regularly scheduled reports, it is recommended to create templates and only replace the data sources afterward to reduce repetitive work.
- 4The official states that data is stored with encryption and not used for training; for confidential data, it is still recommended to first obtain internal compliance confirmation.
- 5Don't overload the dashboard with charts; organize a single dashboard page around one conclusion, which is more persuasive than cramming ten charts into it.
- 6Unify data sources and templates during team collaboration to avoid inconsistent metrics across individual work.
Traffic & popularity
Data month Sep 2026
Bricks receives about 82.4K visits per month and ranks #598,848 worldwide.
Monthly visits
12 monthsTraffic sources
- Search79.9%
- Direct10.9%
- Referrals7.3%
- Social1.3%
- AI assistants0.5%
Top countries
- United States45.9%
- India6.9%
- United Kingdom4.4%
- Canada3.8%
- Philippines2.9%
Estimated from third-party traffic data.
Similar tools
 GPT ExcelAn AI assistant for spreadsheet workers, generating formulas, pivot tables and charts in natural language, as well as cleaning data, writing scripts, and transforming spreadsheets into slides, reports or executive summaries.
 ThunderbitAn AI web scraping plugin built into Chrome. You can organize web pages, PDFs or images into tables by describing fields in natural language. It supports accessing subpages to complete data and exporting to spreadsheet tools, making it ideal for sales and operations teams to collect contact lists.
 AirOpsGrowth Services and Platforms for the AI Search Era: First, look at a brand's share among key buyers rather than a single visibility score, then pair it with channel strategies, and continuously produce and refresh content using agents, data and brand governance.
 TinyFishWeb infrastructure for AI agents enables real-time searching, crawling, and structured extraction of web data. It also supports logging into backend portals for automatic form filling, making it suitable for data collection, competitor monitoring, and process automation.
 SheetGodA table-oriented AI assistant that can generate Excel formulas, VBA macros, regular expressions and Apps Script code by describing requirements in English. The official claims that it also provides step-by-step tutorials and plug-in expansion capabilities.
 Context.devA web data interface for AI agents that can crawl any URL into plain text directly readable by large models, supports real-time search, full-site crawling and structured extraction, and is commonly used to build retrieval knowledge bases and automatically collect web page information.