


BetterDB
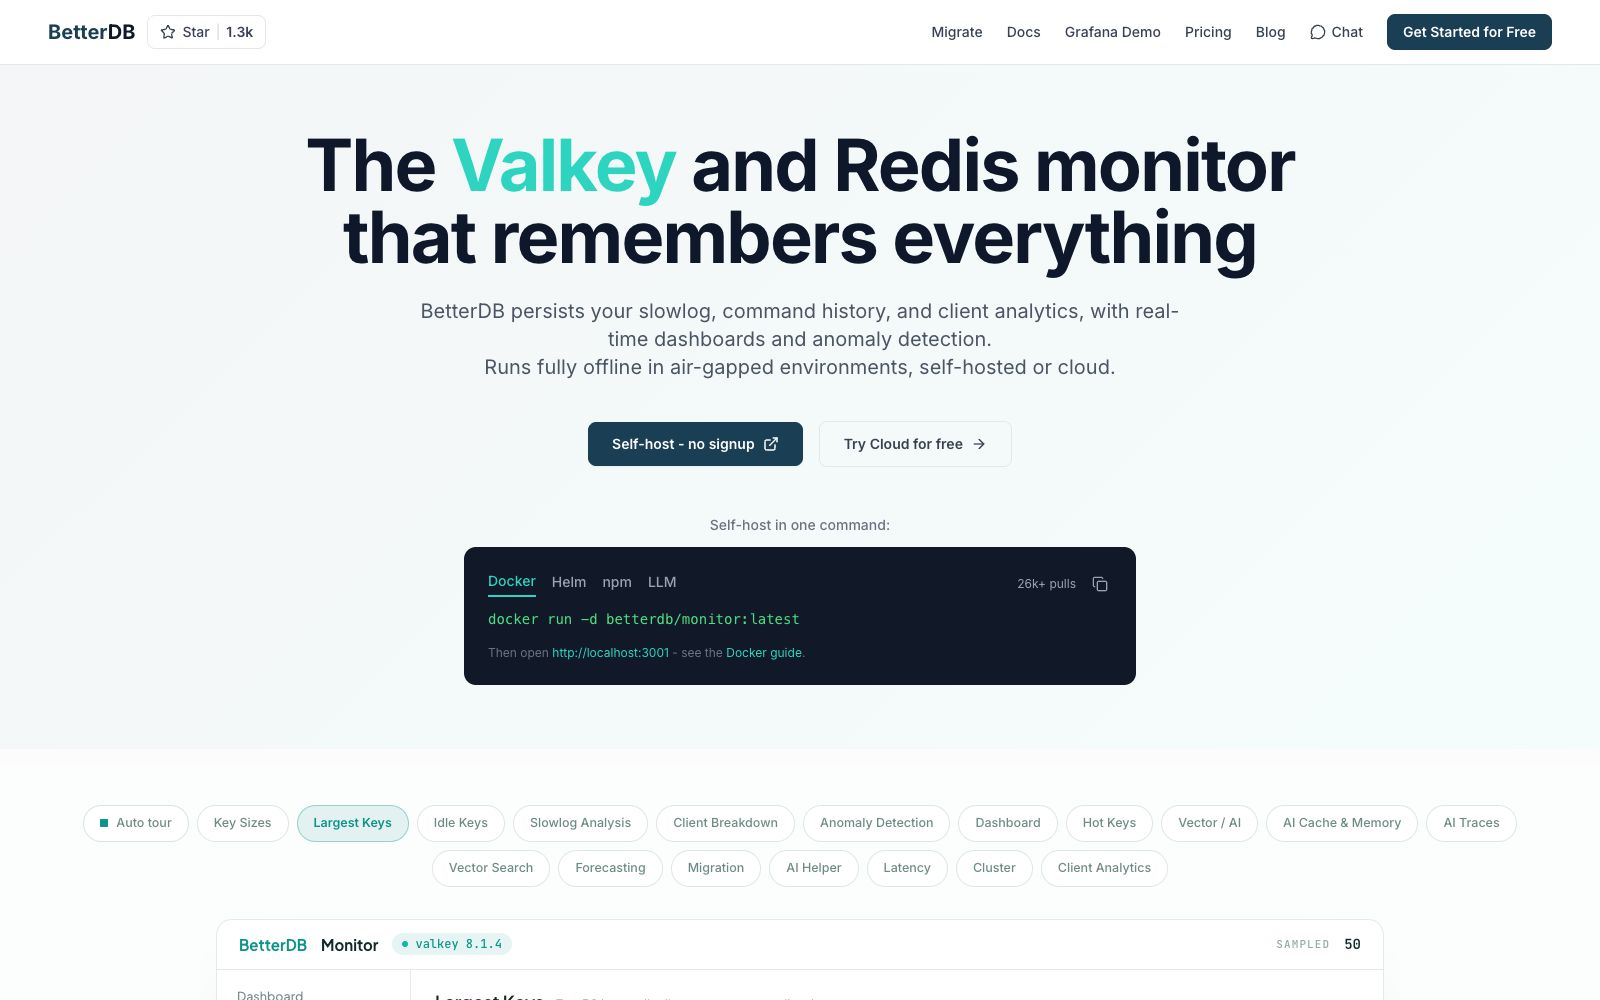
A monitoring and auditing platform for Valkey and Redis, officially claims to persist slow queries and command history, provides real-time dashboards, anomaly detection, Prometheus integration and MCP interface, and supports offline deployment.
Updated: 2026-10-27
What is BetterDB?
BetterDB focuses on the observability of Valkey and Redis, and it is officially described as "a monitor that remembers everything". In addition to real-time dashboards, it also persists slowlogs, command history and client analysis, enabling teams to look back at what happened at a specific moment in the past, rather than just the current state. It is open-source at its core, supporting self-hosting, cloud deployments and fully air-gapped offline environments.
Who is it for?
- Backend teams running Valkey or Redis in production who need to review slow queries and command history.
- AI application teams that use vector search and RAG and need to monitor index health and inference latency.
- Database administrators with compliance or audit requirements who need to track ACL access records.
- Enterprises whose data cannot leave the intranet and require air-gapped deployment.
Key features
6Persistent Monitoring
Saves slowlogs and complete command histories. The COMMANDLOG feature in Valkey 8.1+ captures every command, facilitating fault troubleshooting and auditing.
Anomaly Detection
Automatically identifies abnormal patterns in memory, CPU, and connections, and provides cluster security protection against split-brain, replica freezes, and data loss.
Key and Client Analysis
Analyze key size distribution based on server-side histograms, view key patterns by namespace and type, and identify resource-intensive clients and abnormal buffers.
Vector & AI Workloads
For RAG and semantic search scenarios, it tracks FT.SEARCH throughput, latency, index health and backfill progress, and supports vector index browsing and similarity search.
Prometheus and OpenTelemetry
Provides 100+ Prometheus metrics, OTLP collection and distribution, and webhook alerts, enabling integration with existing monitoring stacks.
MCP and Migration
Enable clients such as Claude Code and Cursor to perform diagnostic queries in natural language via the MCP Server; also support data migration and validation between Redis, Valkey, cloud and self-hosted environments.
How to use BetterDB
- 1For a quick trial, you can self-host using the official Docker command without registration. First, connect a non-critical instance to familiarize yourself with the dashboard.
- 2Point the data backend to your own PostgreSQL or SQLite to decide the data storage location and retention strategy.
- 3Enable slow query, latency and exception alerts, and first use historical data to calibrate thresholds to avoid alert fatigue.
- 4Use MCP Server to connect database diagnostics to Claude Code or Cursor, allowing agents to directly query slowlogs and exceptions in natural language.
- 5Please refer to the official website's latest instructions for specific licenses and paid features. During the current early access phase, Pro and Enterprise features are available for free.
Traffic & popularity
Data month Sep 2026
BetterDB receives about 3.2K visits per month and ranks #4,699,514 worldwide.
Monthly visits
11 monthsTraffic sources
- Direct38.6%
- Search37.6%
- Referrals9.1%
- Social6.1%
- Mail2.9%
- Other5.7%
Top countries
- India96.0%
- Poland4.0%
Estimated from third-party traffic data.
Similar tools
 PortkeyA production-grade platform for generative AI that unifies access to multiple models via an AI gateway, equipped with observability, guardrails, governance and prompt management, and has now been renamed PRISMA AIRS AI Gateway.
 AI2sqlAn AI SQL assistant based on your real database table structure that generates, explains, fixes, and optimizes queries in natural language, and supports direct database connection for clients such as Claude, Cursor, and ChatGPT via MCP.
 Agent CloudAn open-source enterprise RAG and data access platform, according to its official website, can synchronize files and business data from more than 260 data sources, perform segmentation, embedding and vectorized storage, support self-hosted or cloud-based deployment, and enable teams to securely query internal data using private models.
 Helicone AIHelicone is an open-source LLM observability and AI gateway platform: request logs, monitoring alerts, policy routing, multi-dimensional segmentation and HQL analysis, access with one line of base_url modification, used by the fastest-growing AI companies.