


Analytify
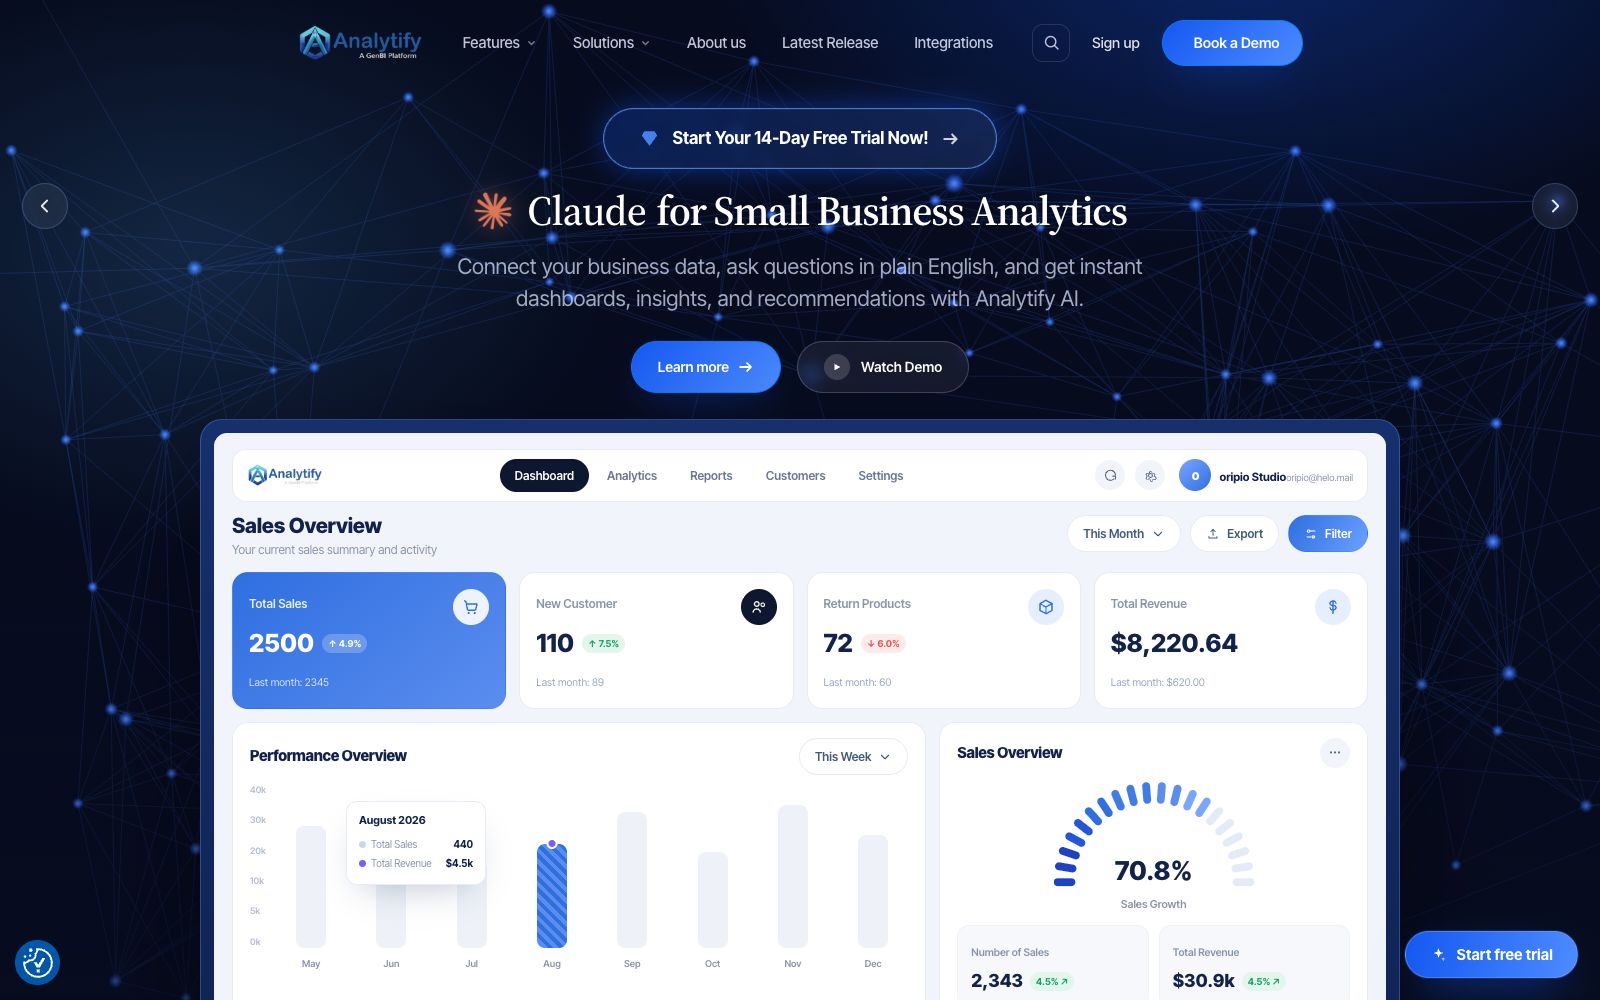
Analytify is an AI-driven analytics platform: business teams ask questions in everyday language, GenieAIQ generates queries, charts and narrative insights, and turns the results into shareable dashboards while retaining metric governance and self-hosting capabilities.
Updated: 2026-10-27
What is Analytify?
The official website of Analytify positions itself as an AI-Powered Analytics Platform, and uses GenBI to summarize its usage method: after business teams connect to data sources, they describe what they want to see in everyday language, and GenieAIQ is responsible for generating queries, charts, narrative insights and shareable dashboards. The official website emphasizes that the process from "question to dashboard" only takes three steps: connect data, ask questions in natural language, and view charts and insights. There is no need to write SQL, nor wait for analysts to generate reports.
Who is it for?
- Operations, sales, and marketing teams who want their business colleagues to ask questions directly, reduce report backlogs, and cut reliance on SQL.
- Medium and large organizations that need to unify indicatormetrics while retaining data access and permission governance.
- Analysts who need to perform joined analysis across databases, CRMs, ERPs and spreadsheets.
- Retail, manufacturing, and logistics teams that want to visualize regional performance, customer distribution, and logistics monitoring on the same map.
- Engineering teams that want to self-host their analytics stack and have full control over code and deployment.
Key features
6Natural Language Generation for Analytics
The official website states that GenieAIQ can convert English questions into queries, charts, and narrative insights, and displays the generated SQL to let users know where the datametrics comes from.
Self-service report editing
Business users can add or remove columns, switch chart types, filter, sort and group data in real time, and save personalized views for direct reuse the next time.
Multi-source Connection and Associated Queries
The data sources listed on the official website include PostgreSQL, Snowflake, Salesforce, Excel/CSV, etc. It also states that it supports more than 750 applications, and can associate data in the same query after accessing in read-only mode.
Geospatial Analysis
Location data can be used to generate interactive maps, supporting drill-down from global, country to city levels, for observing regional performance, customer distribution and logistics.
Metric Governance Framework
Business metrics, synonyms, and guardrail rules are defined and managed through Skills; the official website states that Genie assembles dashboards based on published Skills, enabling different teams to use consistent data definitions.
Enterprise Security & Self-Hosting
The official website lists SSO/SAML, role-based access control, SOC 2 Type II and ISO 27001 certifications, and states that the product is self-hostable and available under the MIT License to avoid vendor lock-in.
How to use Analytify
- First run a real business problem with existing tables or databases, then decide whether to promote it to the entire team.
- for natural language analysis, verify the SQL and datametrics, not just the chart effects.
- Before launching, first define core metrics, synonyms and restriction rules in Skills to avoid the same metric having differentmetrics in different reports.
- Organize common questions into reusable dashboards and personalized views to reduce repeated queries and redundant modeling.
- When dealing with customer, order, or employee data, configure SSO, role-based access control, and row-level filtering first before granting access to business teams.
- When considering self-hosting, evaluate the costs of servers, data synchronization, and operations in advance.
- the managed version is suitable for prioritizing value validation, while self-hosting is ideal for organizations with infrastructure teams.
Traffic & popularity
Data month Sep 2026
Analytify receives about 717 visits per month and ranks #27,103,515 worldwide.
Monthly visits
12 monthsTraffic sources
- Direct38.9%
- Search35.8%
- Referrals9.5%
- Social6.1%
- Mail3.2%
- Other6.6%
Top countries
- United States70.9%
- India29.1%
Estimated from third-party traffic data.
Similar tools
 Better AnalystBetter Analyst (formerly Formula Bot) is an all-in-one data analysis application that can connect to data sources and generate analyses, dashboards, reports, and automated workflows. It is designed for individuals and growing businesses without a dedicated analytics team.
 DashboardGPTDashboardGPT is a conversational analytics workspace: upload a CSV or Excel file, ask questions in natural language, and watch the answers arrive as movable nodes on an infinite canvas, powered by Superset.
 MktIndexMirror Insight is an AI analyst for the online retail market. It conducts market research, competitive analysis, consumer insights and product innovation based on e-commerce and social media data, and provides overseas market insights, suitable for brand owners and e-commerce operation teams.
 Statty AIStatty AI is an e-commerce business intelligence dashboard that aggregates sales, customer, product, and inventory data from stores and marketplaces in one place. It offers revenue and repurchase analysis, inventory alerts, and AI-powered insight Q&A, which can explain changes in metrics and generate reports in natural language. It is suitable for multi-platform e-commerce sellers to conduct business reviews, growth attribution, and product selection decision-making.
 AI2sqlAn AI SQL assistant based on your real database table structure that generates, explains, fixes, and optimizes queries in natural language, and supports direct database connection for clients such as Claude, Cursor, and ChatGPT via MCP.
 Power BIA business intelligence platform launched by Microsoft, it connects and unifies enterprise data, empowers everyone's self-service BI with credible semantic models and Copilot's natural language insights, and can be embedded into Microsoft 365 workflows.