


Power BI
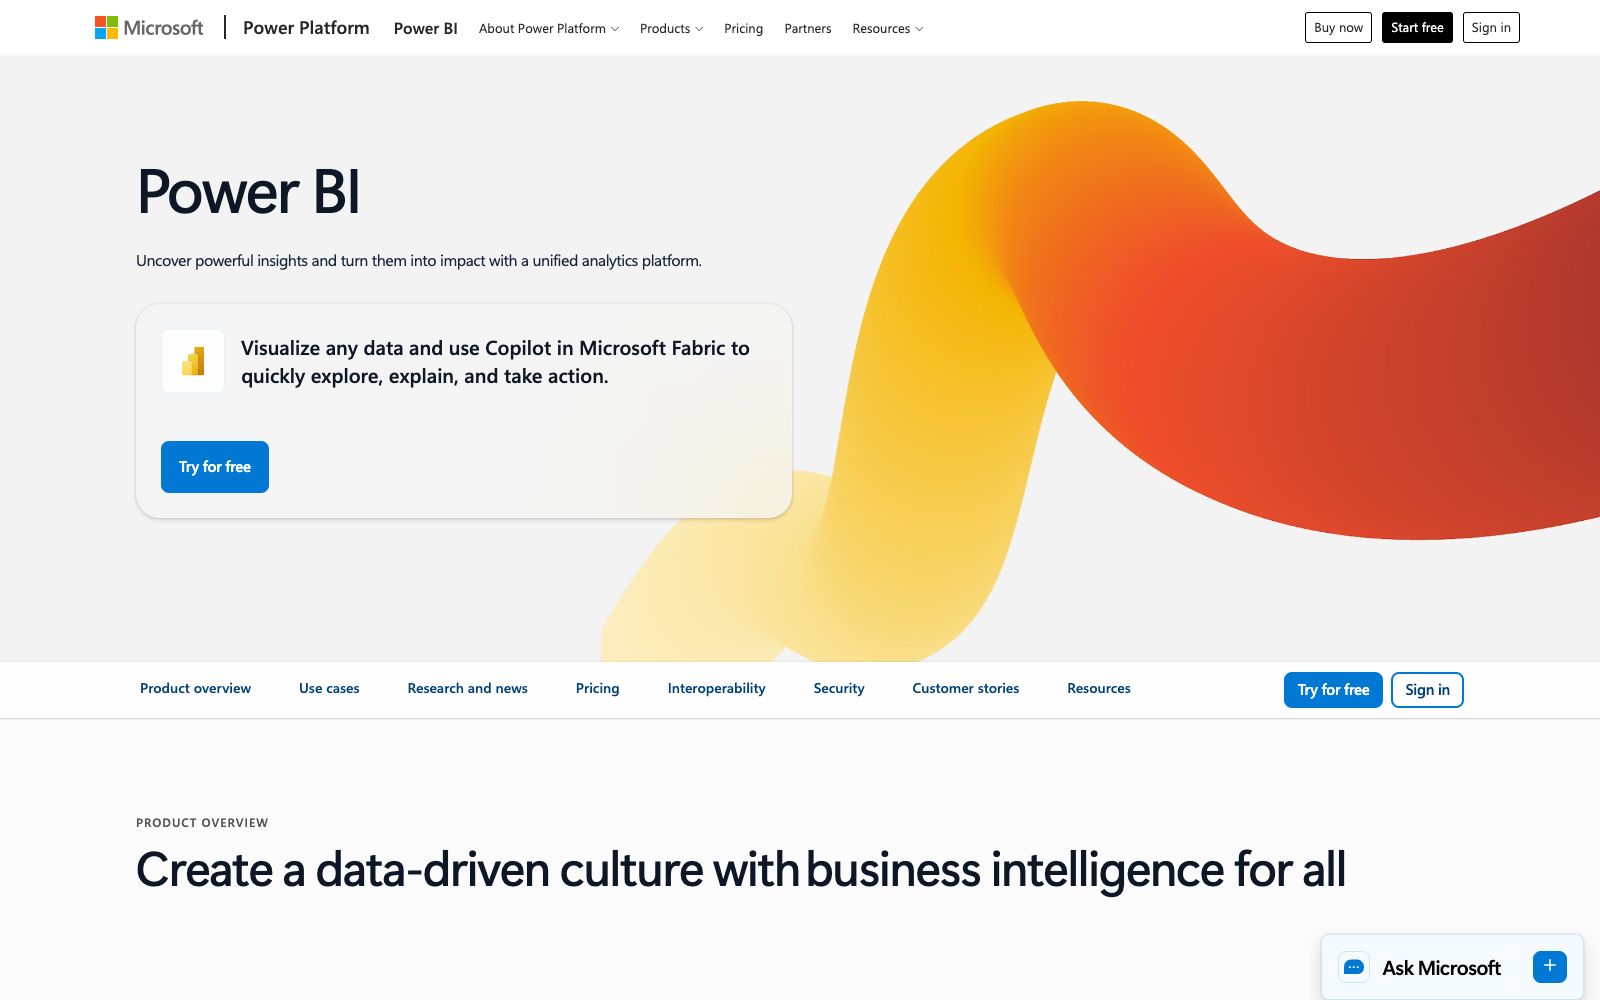
A business intelligence platform launched by Microsoft, it connects and unifies enterprise data, empowers everyone's self-service BI with credible semantic models and Copilot's natural language insights, and can be embedded into Microsoft 365 workflows.
Updated: 2026-10-26
What is Power BI?
Power BI is a business intelligence (BI) platform launched by Microsoft, part of the Microsoft Power Platform family. Its official website states that it helps "visualize data and inject insights into your existing Microsoft 365 apps". Its positioning is to integrate governed data, credible metrics and interactive insights into a unified enterprise decision-making layer, enabling all teams to make decisions faster and with more confidence. Unlike lightweight tools that only do chart drawing, Power BI excels in deep integration with enterprise data stacks (such as OneLake and Microsoft Fabric) and built-in Copilot AI capabilities: you can ask questions in natural language and let AI quickly provide explanations and narratives. It also offers a variety of plans including free accounts, Power BI Pro and Premium Per User.
Who is it for?
- Enterprises that already use Microsoft 365 and want to embed data insights into their daily office work.
- Data teams that need to unify metric definitions and data governance (semantic models, OneLake).
- Business professionals who want to build dashboards and conduct daily analysis on their own without relying on IT.
- Developers who need to embed BI reports into their own products or portals.
- Management teams who want to make decisions driven by data and establish a unified decision-making layer.
Key features
6Data Connection and Unification
Connect and integrate data scattered across various locations to form a unified, governed data foundation.
Self-service BI
Open self-service analysis for all employees, enabling business users to build dashboards without writing code.
Trusted Semantic Models
Enterprise-grade semantic models ensure that every report and every AI interaction is based on a unified business framework.
AI Insights (Copilot)
Copilot in Microsoft Fabric supports natural language queries and AI-generated insights and narratives, eliminating the manual step of "from question to insight".
Highly Interactive Visualization
Transform data into interactive visual charts, making conclusions clear at a glance and facilitating comparison and action.
Embedding and Integration
You can embed BI reports into your own applications and connect insights to the workflows in Microsoft 365.
How to use Power BI
- For implementation, it is recommended to first connect the data to Power BI, build a semantic model, unify indicator definitions, and then let the business side conduct self-service analysis.
- This can prevent each department from calculating independently.
- Using Copilot for natural language queries and rapid insights is very convenient, but key figures still need to be manually reviewed, and AI narratives should not be directly used as conclusions.
- Individuals and small teams can start with a free account trial.
- for team collaboration, sharing, and larger-scale deployments, a Power BI Pro or Premium Per User subscription is required.
- Enterprise-level governance can unify permission control with OneLake and security policies.
- The functions and prices of each subscription plan vary by version and region, so please refer to the official website's current page description before subscribing.
Traffic & popularity
Data month Sep 2026
Power BI receives about 195.8K visits per month.
Monthly visits
12 monthsTraffic sources
- Search38.7%
- Direct29.9%
- Mail21.9%
- Referrals6.7%
- Social1.8%
- Other1.0%
Top countries
- India21.0%
- Brazil10.7%
- Japan6.8%
- Thailand6.8%
- Russia5.6%
Estimated from third-party traffic data.
Similar tools
 FineBIThe enterprise-level self-service BI platform under FanRuan, version 7.0, centrally manages metrics and lineages with indicators as the core, offering self-service dashboards, AI Q&A and attribution warnings. According to the official website, it has served over 43,000 customers.
 Microsoft DesignerAn AI graphic design tool launched by Microsoft, which can generate posters, social media posts, invitations and custom images with prompt words. It supports AI editing and manual design from scratch, and covers a rich range of template types such as images, icons and wallpapers.
 ZettaZetta is an AI data analysis platform for business teams. Officially, it offers conversational AI data analysts, automated insights, visual dashboards and data warehouses, enabling businesses to gain clear insights into data without the need for a dedicated data team.
 Hengshi TechnologyHengshi Technology's new-generation AI-enhanced Agentic BI platform provides data integration, indicator modeling, visual analysis and ChatBI capabilities, and opens command-line tools for coding agents to execute BI projects, targeting software vendors and group IT teams.
 Yonghong TechnologyYonghong Technology's enterprise-level AI data intelligence platform offers a product matrix including BI analysis, intelligent data query, data modeling, indicator management and data governance. The company officially states that it has ranked first in China's BI (Business Intelligence) field for consecutive sessions, serving enterprise-level data analysis scenarios.
 PapercraneA data command center platform for teams, which, according to its official website, can connect to over a thousand tools such as Salesforce and databases, transform data into shareable real-time dashboards, and automatically execute business actions like follow-up reminders and report summarization according to schedules, with support for SOC 2 and HIPAA compliant deployment.